>
> |
| META TOPICPARENT |
name="SubmitCaseStudy" |
<--
This template controls both the look and functionality of case study topics.
You should not need to alter the layout, only edit the data using the form above.

Set the view and edit templates:
Comment out the next line to use the TWiki default view
Comment out the next line to use the TWiki default edit
-->
<--
This topic can only be changed by:
-->
Case Study: Simple Health Clinic – Scheduled Appointments
Submitted: 10 Sep 2017
Application Areas: Healthcare
Contents
Problem Description
This case study extends the Simple Health Clinic (SHC) model. In that case study walk-up patents waited for treatment by a doctor. In this case study an additional doctor is present in the clinic, one that sees patients with scheduled appointments. The second doctor can also treat walk up patients if they are free.
The goal of this simulation study is to analyse the average time patients spend:
- waiting for treatment; and
- in the clinic;
and the average length of the patient queue (which informs waiting room size). This analysis will include a comparison of the walk-up vs scheduled patients.
Return to top
Problem Formulation
In order to formulate a simulation model we specify the following components:
- Background – problem description
- Objectives of the study
- Expected benefits
- The CM: inputs, outputs, content, assumptions, simplifications’
- Experiments to run
Components 1(Background – problem description) and 2 (Objectives of the study) are given in the Problem Description section (see paragraph describing the goal of the simulation study to identify study objectives).
The Expected benefits (component 3) are a virtual environment for evaluating patient waiting times, total time patients spend in the clinic, and the number of patients waiting for treatment. This environment can be used to experiment with changes to the clinic, including a comparison of effects on the waiting times, queue length, etc for the walk-up vs the scheduled patients.
The CM content is specified using the following components:
- Component List
- Process flow diagram
- Logic flow diagram
- Activity cycle diagram
Component List
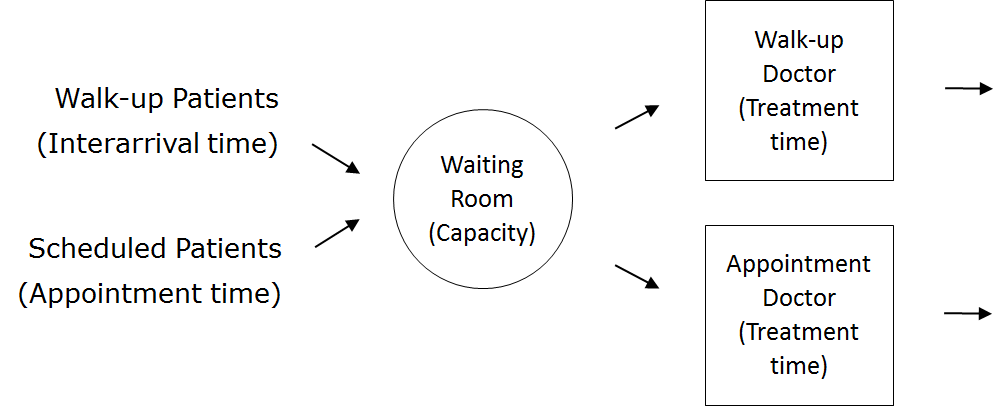
The components of the Simple Health Clinic with Scheduled Appointments model are:
- Walk-up patients with their (inter)arrival times
- Scheduled patients with their appointment times
- Doctors with their treatment times
- Waiting room with its capacity
Process Flow Diagram
| Patient Logic Flow Diagram | | Doctor Logic Flow Diagrams |
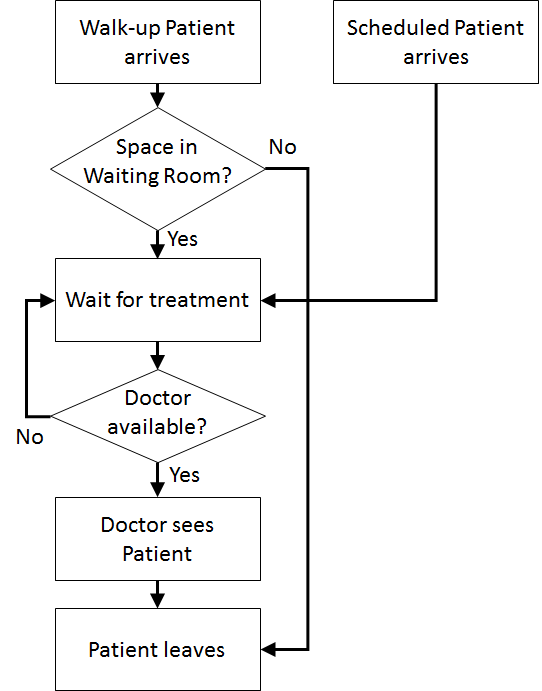 | | 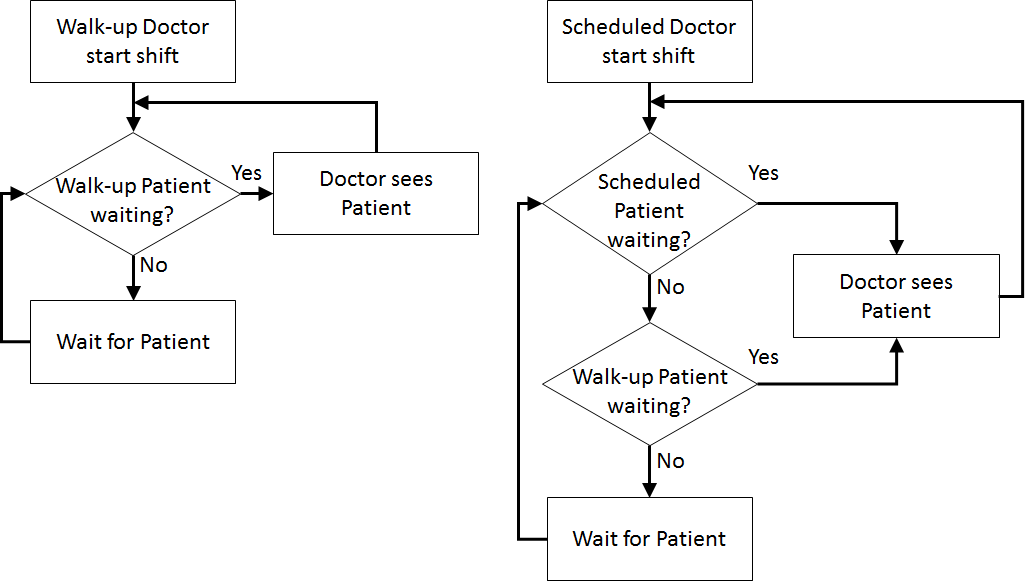 |
Activity Cycle Diagram
 Once the content has been established (note this is usually an iterative process) we can identify the inputs and outputs: appointment times, interarrival times, treatment times, waiting times (Patient arrives to Doctor sees patient), total clinic time (Patient arrives to Outside), number in waiting room.
Assumptions are used to define stochasticity (e.g., Exponential interarrivals, Triangular treatment times) and the simplifications keep the system simple (e.g., one doctor on all day, no registration, no prioritisation).
Return to top
Once the content has been established (note this is usually an iterative process) we can identify the inputs and outputs: appointment times, interarrival times, treatment times, waiting times (Patient arrives to Doctor sees patient), total clinic time (Patient arrives to Outside), number in waiting room.
Assumptions are used to define stochasticity (e.g., Exponential interarrivals, Triangular treatment times) and the simplifications keep the system simple (e.g., one doctor on all day, no registration, no prioritisation).
Return to top
Computational Model
Start with the Simple Health Clinic JaamSim model.
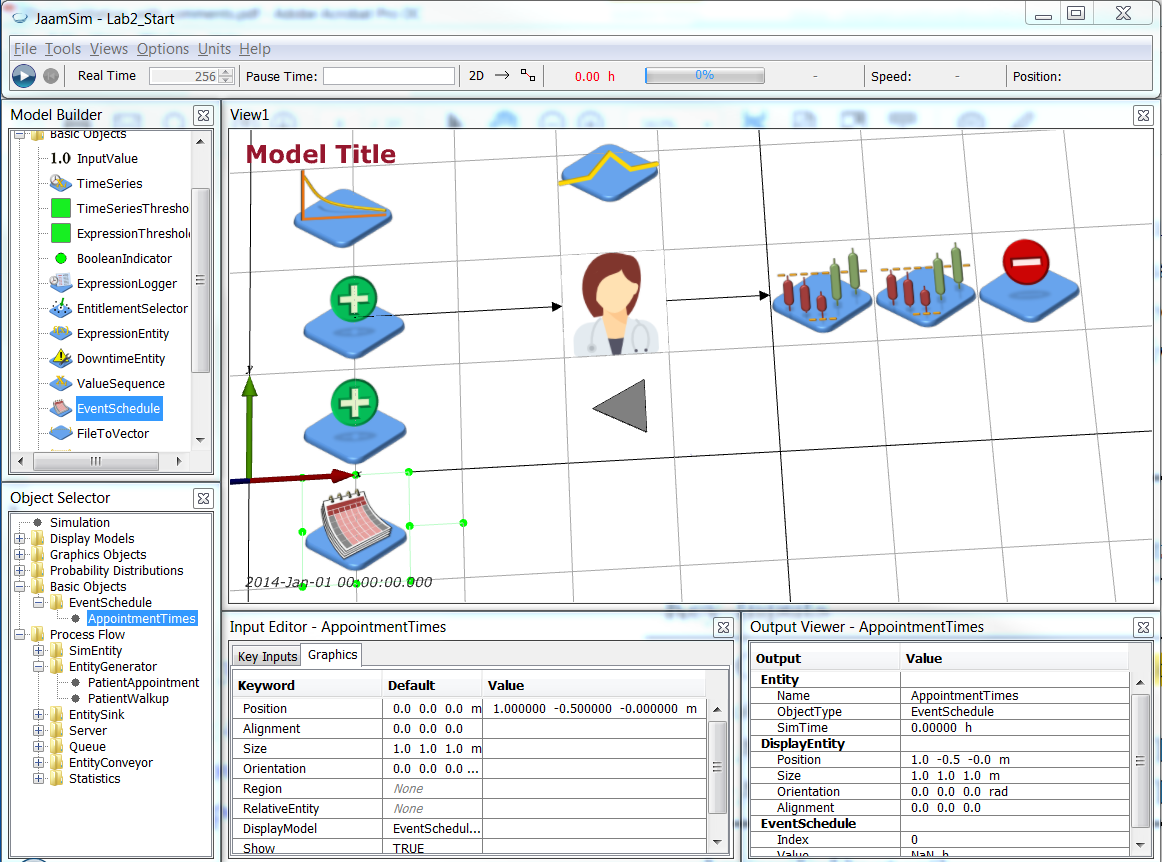
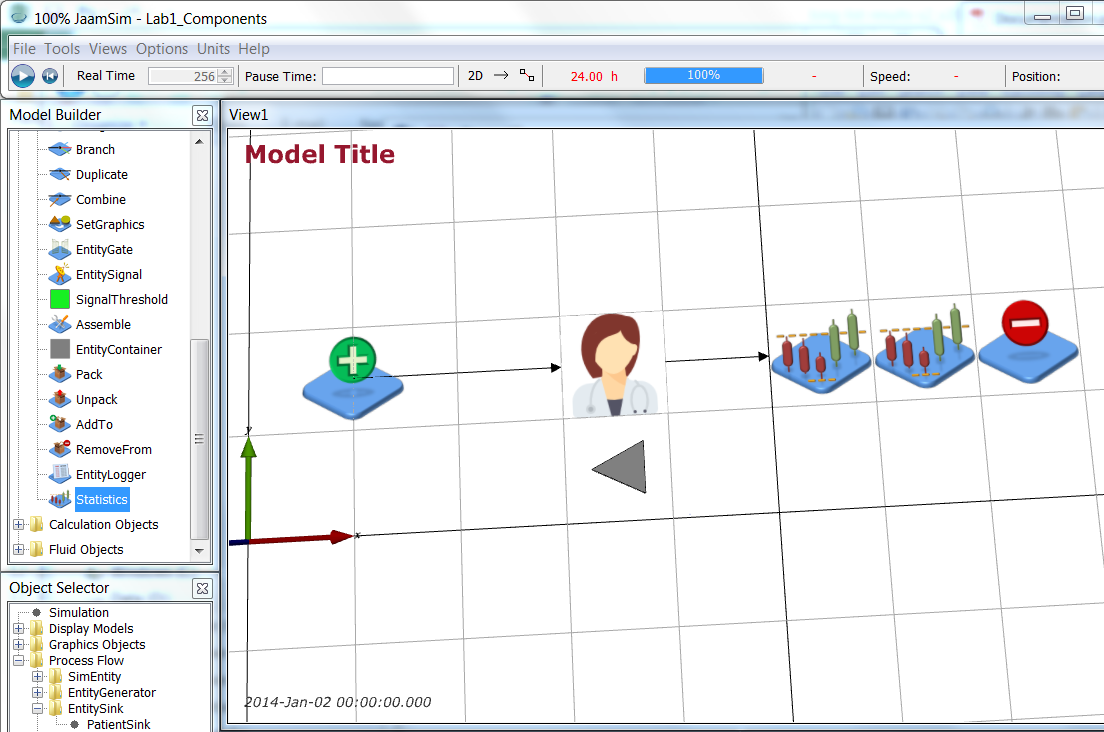 Rename the PatientGenerator object PatientWalkup. Now add a second EntityGenerator (ProcessFlow > EntityGenerator) and name it PatientAppointment. You can position it at 1 -0.5 0 m (Input Editor > Graphics > Position). Add an EventSchedule object (BasicObjects > EventSchedule) at 1 -1.5 0 m and name it AppointmentTimes.
Note To move objects within the View1 window with the mouse, hold down Ctrl and click on the object with the left mouse button. Keep the mouse button down when moving the object around.
Rename the PatientGenerator object PatientWalkup. Now add a second EntityGenerator (ProcessFlow > EntityGenerator) and name it PatientAppointment. You can position it at 1 -0.5 0 m (Input Editor > Graphics > Position). Add an EventSchedule object (BasicObjects > EventSchedule) at 1 -1.5 0 m and name it AppointmentTimes.
Note To move objects within the View1 window with the mouse, hold down Ctrl and click on the object with the left mouse button. Keep the mouse button down when moving the object around.
 Save your simulation.
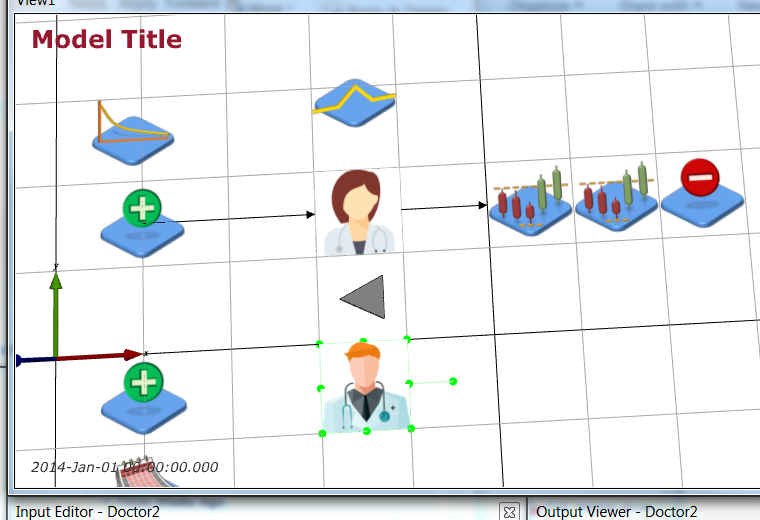
Now add a second doctor (Process Flow > Server) at 3.5 -0.5 0 m, name it Doctor2 and give it the doctor2.png (icon made by Freepik from www.flaticon.com
Save your simulation.
Now add a second doctor (Process Flow > Server) at 3.5 -0.5 0 m, name it Doctor2 and give it the doctor2.png (icon made by Freepik from www.flaticon.com ). ).
 Save your simulation.
Next, add a new EntityConveyor (Process Flow > EntityConveyor) from PatientAppointment to Doctor2 as shown and update Key Inputs so that patients are generated at PatientAppointment and flow to Doctor2 across ArriveToTreat2. The EventSchedule object requires an input called TimeList which defines times in the simulation at which events occur. The EventSchedule object provides the inter-arrival times for the specified sequence of event times to the EntityGenerator object to create the entities at the specified times. In this case we want to use data from a separate file to define the appointment times so the TimeList input is left blank. Also, give Doctor2 the same treatment time as Doctor.
Save your simulation.
Next, add a new EntityConveyor (Process Flow > EntityConveyor) from PatientAppointment to Doctor2 as shown and update Key Inputs so that patients are generated at PatientAppointment and flow to Doctor2 across ArriveToTreat2. The EventSchedule object requires an input called TimeList which defines times in the simulation at which events occur. The EventSchedule object provides the inter-arrival times for the specified sequence of event times to the EntityGenerator object to create the entities at the specified times. In this case we want to use data from a separate file to define the appointment times so the TimeList input is left blank. Also, give Doctor2 the same treatment time as Doctor.
| Object |
Graphics |
Key Inputs |
| PatientAppointment |
|
NextComponent = ArriveToTreat2, PrototypeEntity = PatientEntity, FirstArrivalTime = AppointmentTimes, InterArrivalTime = AppointmentTimes |
| AppointmentTimes |
|
TimeList =, CycleTime = 24 h |
| ArriveToTreat2 |
Points = { 1 -0.5 0.000 m } { 3 -0.5 0.000 m }, DisplayModel = ArrowModelDefault |
NextComponent = Doctor2, StateAssignment = Arrive, TravelTime = 2 min |
| Doctor2 |
|
StateAssignment = Treat, ServiceTime = '([Simulation].RunIndex(1) == 1) || ([Simulation].RunIndex(1) == 2) ? 15[min] : [TreatmentDist].Value' |
Once the EventSchedule object is set up as described above save the simulation model. In the resulting .cfg file the following two lines should have been added (although they will not be lines 1 and 2).
1: Define EventSchedule { AppointmentTimes }
2: AppointmentTimes CycleTime { 24 h }
Open your .cfg file with Notepad++, find these lines and add the following line after them
3: Include '.\AppointmentTimes.inc'
This line tells the config file to look for a file called AppointmentTime.inc and include all of the text in that file at this point in the config file. Download the AppointmentTimes.inc file into the same directory as your .cfg file.
AppointmentTimes.inc defines the TimeList for the AppointmentTimes object. If an appointment time needs to be changed then we can change the corresponding time in the AppointmentTimes.inc file. Alternatively if we have a list of appointment times saved elsewhere, for example in an Excel file, then they can be copied and pasted into the .inc file. Note that the appointment times are repeated every 24 hours according to AppointmentTimes.inc.
Save your .cfg file. You then need to reopen the file for the change to be added (otherwise the next time you save the Include statement will be lost from the .cfg file).
Now that scheduled patients are arriving according to their appointment times, we want to be able to distinguish between walk-up and scheduled patients. Add an (empty string) PatientType attribute to the PatientEntity object by setting Key Inputs > AttributeDefinitionList:
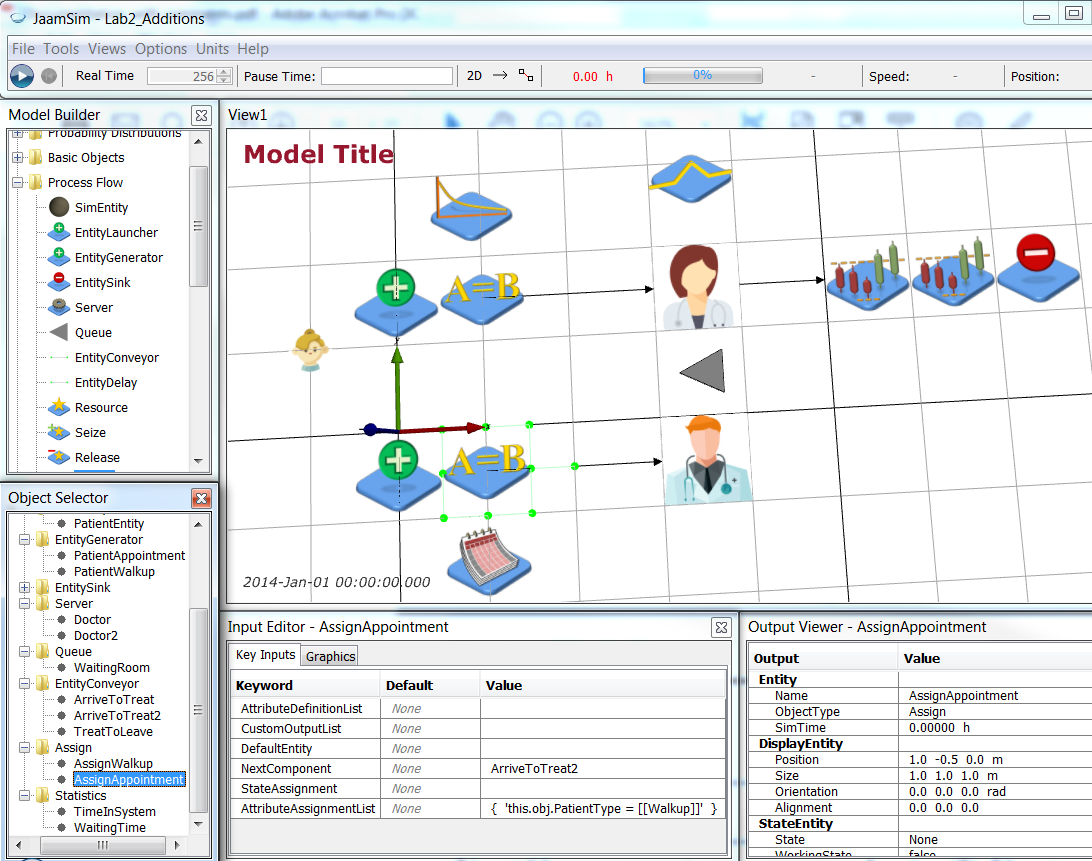
Next we add two Assign objects (Process Flow > Assign) named AssignWalkup and AssignAppointment respectively. We position these between the Patient generators and the ArriveToTreat* conveyors both graphically and in the NextComponent values.
| Object |
Graphics |
Key Inputs |
| PatientWalkup |
Position = 0 1.5 0.000000 m |
NextComponent = AssignWalkup |
| PatientAppointment |
Position = 0 -0.5 0.000000 m |
NextComponent = AssignAppointment |
| AssignWalkup |
Position = 1 1.5 0.000000 m |
NextComponent = ArriveToTreat, AttributeAssignmentList = { 'this.obj.PatientType = "Walkup"' } |
| AssignAppointment |
Position = 1 -0.5 0.000000 m |
NextComponent = ArriveToTreat2, AttributeAssignmentList = { 'this.obj.PatientType = "Appointment"' } |
 Save your simulation.
Now we will rename the WaitingRoom Queue object to be WalkupQueue and create a new Queue object AppointmentQueue at 3.5 -1.5 0 m. Make sure to set the StateAssignment of AppointmentQueue to Wait. Set the WaitQueue for Doctor2 to be AppointmentQueue.
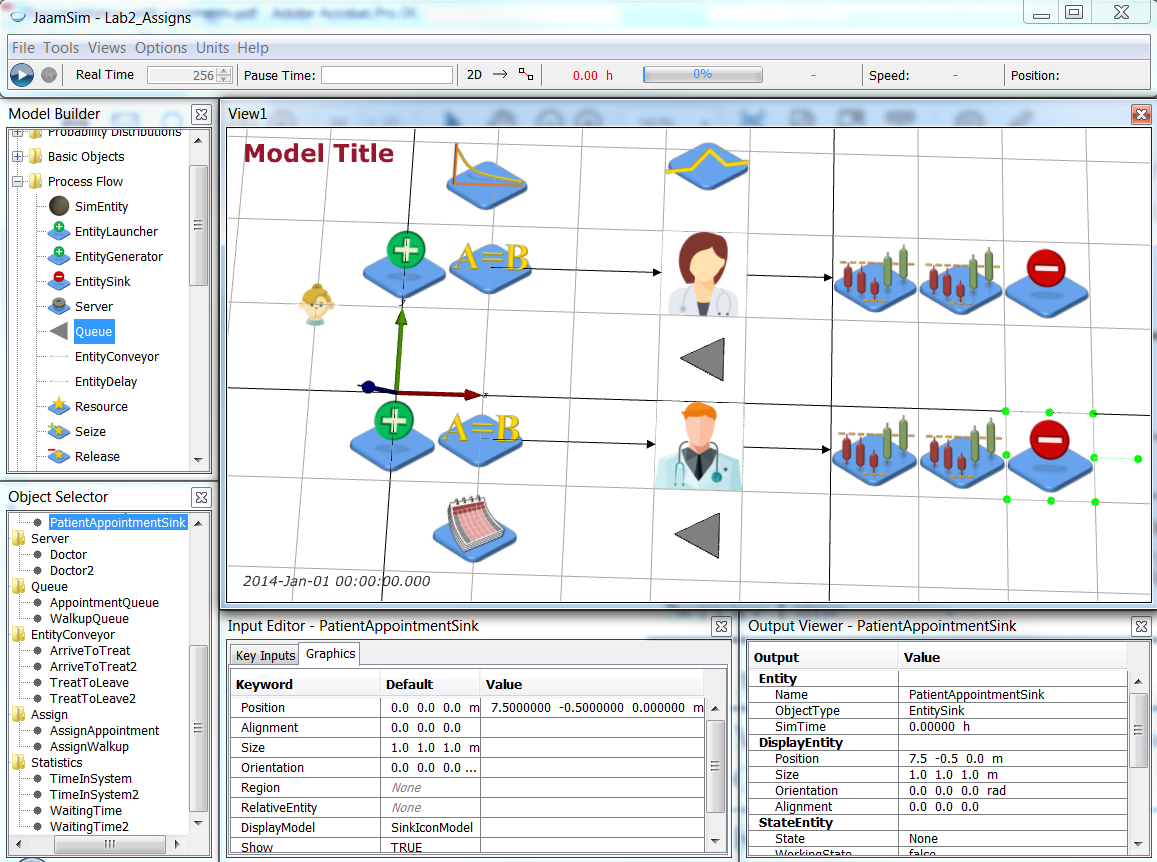
Next we need to duplicate the statistic gathering for the walkup patients to get similar statistics for the scheduled patients. Select the TreatToLeave EntityConveyor, right click and select Duplicate. Rename the duplicate TreatToLeave2 and adjust the y-position of its Points to be -0.5. Repeat this for the two Statistics objects to create TimeInSystem2 and WaitingTime2 at 5.5 -0.5 0 m and 6.5 -0.5 0 m respectively. Finally, repeat this for the PatientSink object (at 7.5 -0.5 0 m), but rename the two EntitySink objects to be PatientWalkupSink (the old one) and PatientAppointmentSink (the duplicate) respectively.
Save your simulation.
Now we will rename the WaitingRoom Queue object to be WalkupQueue and create a new Queue object AppointmentQueue at 3.5 -1.5 0 m. Make sure to set the StateAssignment of AppointmentQueue to Wait. Set the WaitQueue for Doctor2 to be AppointmentQueue.
Next we need to duplicate the statistic gathering for the walkup patients to get similar statistics for the scheduled patients. Select the TreatToLeave EntityConveyor, right click and select Duplicate. Rename the duplicate TreatToLeave2 and adjust the y-position of its Points to be -0.5. Repeat this for the two Statistics objects to create TimeInSystem2 and WaitingTime2 at 5.5 -0.5 0 m and 6.5 -0.5 0 m respectively. Finally, repeat this for the PatientSink object (at 7.5 -0.5 0 m), but rename the two EntitySink objects to be PatientWalkupSink (the old one) and PatientAppointmentSink (the duplicate) respectively.
 You will need to change the NextComponent Key Values of the duplicate objects as follows:
| Object |
Graphics |
Key Inputs |
| Doctor2 |
|
NextComponent = TreatToLeave2 |
| TreatToLeave2 |
Points = { 4 -0.5 0.000 m } { 5 -0.5 0.000 m } |
NextComponent = TimeInSystem2 |
| TimeInSystem2 |
Position = 5.5 -0.5 0.000 m |
NextComponent = WaitingTime2 |
| WaitingTime2 |
Position = 6.5 -0.5 0.000 m |
NextComponent = PatientAppointmentSink |
| PatientAppointmentSink |
Position = 7.5 -0.5 0.000 m |
|
Save your simulation.
Your simulation now models walkup and scheduled patients being seen by the two doctors separately. You can run your simulation and look at the data file. Recall you used 4 different scenarios in the Simple Health Clinic model and the 4th scenario used stochasticity for both (walkup) arrivals and treatment. Set the Simulation > Multiple Runs as follows:
This means you run 10 replications of scenario 4 (with “full” stochasticity). However, you also need to save the results from the new Statistics objects. Modify the Key Inputs of the Simulation object to get the schedule patients metrics:
| Object |
Key Inputs |
Value |
| Simulation |
GlobalSubstreamSeed |
[Simulation].RunIndex(2) |
| |
UnitTypeList |
DimensionlessUnit TimeUnit TimeUnit DimensionlessUnit DimensionlessUnit |
| |
|
TimeUnit TimeUnit DimensionlessUnit DimensionlessUnit |
| |
RunOutputList |
{ [Simulation].RunIndex(1) } |
| |
|
{ [WaitingTime].SampleAverage } |
| |
|
{ [TimeInSystem].SampleAverage } |
| |
|
{ [WalkupQueue].QueueLengthAverage } |
| |
|
{ [Doctor].Utilisation } |
| |
|
{ [WaitingTime2].SampleAverage } |
| |
|
{ [TimeInSystem2].SampleAverage } |
| |
|
{ [AppointmentQueue].QueueLengthAverage } |
| |
|
{ [Doctor2].Utilisation } |
Save your simulation.
Run your simulation and check the .dat file produced. Your file should look like this:
[Simulation].RunIndex(1)   [WaitingTime].SampleAverage   [TimeInSystem].SampleAverage   [WalkupQueue].QueueLengthAverage   [Doctor].Utilisation   [WaitingTime2].SampleAverage   [TimeInSystem2].SampleAverage   [AppointmentQueue].QueueLengthAverage   [Doctor2].Utilisation
   h   h         h   h
4.0   0.38405366237816774   0.6721529048440543   0.9121274481481481   0.6061936453819444   0.047831163832528174   0.3245097069847021   0.15544167377314747   0.708565400474537
4.0   0.8219966959851419   1.111039798239664   3.3573313594560186   0.914729190023148   0.05137962716586152   0.3368832764814815   0.16999437075231413   0.7295867157986111
4.0   0.18231854541459366   0.4643737348009948   0.5110314945717589   0.697349794861111   0.07290953726190474   0.3614429387301587   0.21870704035879557   0.7456867161226852
4.0   0.15044009060931898   0.4276216531630824   0.4109386495486115   0.6289475324884258   0.04596554312698413   0.3103043237142857   0.13695675836805501   0.6782827043171296
4.0   0.4608621209795323   0.7449073896929822   1.476147013425926   0.7928060206018518   0.039782093476307186   0.3159904990808823   0.15987477151620322   0.6977464573611111
4.0   0.24241772078282825   0.5456477393939393   0.5555406101273154   0.6252009754629629   0.043423220472222225   0.32121606757142857   0.133963723576388   0.7131016586921296
4.0   0.2614094597649572   0.5324488160085471   0.7079839535300925   0.6422825157523149   0.054203878703703696   0.34166384512479875   0.17248607967592514   0.740839141724537
4.0   0.49628468288742683   0.7857048559283626   1.8466593722685183   0.813790779212963   0.04087929695238095   0.320092180547619   0.11923128277777673   0.7245560956712963
4.0   0.20900518749619484   0.4944611306506849   0.6357241119675925   0.7685583299768518   0.07885540460547506   0.38238973465378434   0.25053211532407277   0.7798800384722222
4.0   0.535308072422222   0.8215745958333336   1.6954733292245368   0.8028416117592593   0.029352889542253516   0.29911107867370895   0.08683563156249953   0.6977800132175925
Now, you can observe and compare the performance of the clinic for both Walk-Up and Appointment patients using Lab2Analysis.R. Make sure to edit the path and file name at the top of the Lab2Analysis.R. Your output should have the following values:
and your two sample t-test results should look as follows:
> t.test(Lab2scen$WalkUp.WaitingTime, Lab2scen$Appointment.WaitingTime)

        Welch Two Sample t-test

data:  Lab2scen$WalkUp.WaitingTime and Lab2scen$Appointment.WaitingTime
t = 4.888, df = 9.094, p-value = 0.0008362
alternative hypothesis: true difference in means is not equal to 0
95 percent confidence interval:
 0.1742640 0.4736387
sample estimates:
 mean of x  mean of y
0.37440962 0.05045827
|
> t.test(Lab2scen$WalkUp.TimeInSystem, Lab2scen$Appointment.TimeInSystem)

        Welch Two Sample t-test

data:  Lab2scen$WalkUp.TimeInSystem and Lab2scen$Appointment.TimeInSystem
t = 4.8847, df = 9.2528, p-value = 0.0007988
alternative hypothesis: true difference in means is not equal to 0
95 percent confidence interval:
 0.1770723 0.4801935
sample estimates:
mean of x mean of y
0.6599933 0.3313604
|
> t.test(Lab2scen$WalkUp.Queue, Lab2scen$Appointment.Queue)

        Welch Two Sample t-test

data:  Lab2scen$WalkUp.Queue and Lab2scen$Appointment.Queue
t = 3.6224, df = 9.048, p-value = 0.005502
alternative hypothesis: true difference in means is not equal to 0
95 percent confidence interval:
 0.3950011 1.7059857
sample estimates:
mean of x mean of y
1.2108957 0.1604023
|
> t.test(Lab2scen$Doctor.Utilisation, Lab2scen$Doctor2.Utilisation)

        Welch Two Sample t-test

data:  Lab2scen$Doctor.Utilisation and Lab2scen$Doctor2.Utilisation
t = 0.22466, df = 10.413, p-value = 0.8266
alternative hypothesis: true difference in means is not equal to 0
95 percent confidence interval:
 -0.06797121  0.08330630
sample estimates:
mean of x mean of y
0.7292700 0.7216025
|
Finally, you need to enable the Appointment doctor to also see Walk-Up patients. Rename the Doctor2 Server as Doctor2Appointment and then Duplicate this Server to create Doctor2Walkup. Set Doctor2Walkup’s WaitQueue Value to WalkupQueue so it serves Walk-Up patients and Doctor2Walkup’s NextComponent Value to TreatToLeave so that Walk-Up patients leave via the Walk-Up patient Statistics and Sink.
We control access to the Doctor2* Server objects using ExpressionThresholds. Add two ExpressionThresholds (with the Basic Object palette) and name them AppointmentThreshold and WalkupThreshold respectively. They are positioned at 2.5 -1.0 0.0 m and 2.5 -2.0 0.0 m respectively.
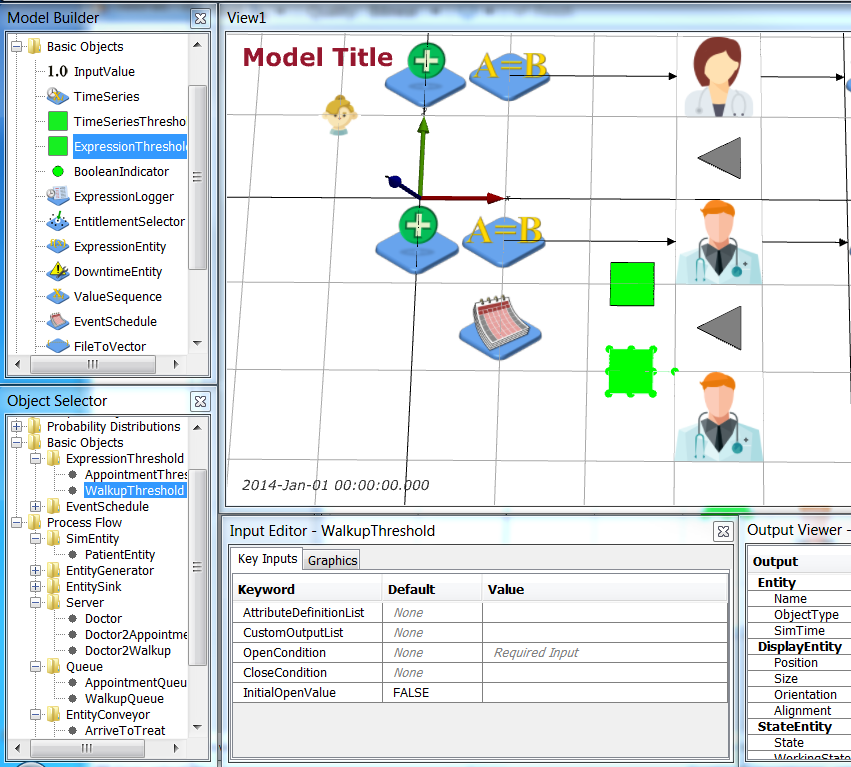 The OpenCondition keyword for the ExpressionThresholds is the expression to be evaluated. If the expression returns 1 or TRUE then the threshold is open, if it is 0 or FALSE it is closed.
The AppointmentThreshold prevents the second doctor from treating patients with appointments while they are treating a Walk-Up patient. If the second doctor is currently treating a Walk-Up patient then the NumberInProgress output for the Doctor2Walkup object will be 1. Thus the AppointmentThreshold will be open if the NumberInProgress is < 1. Set the OpenCondition of AppointmentThreshold to be
The OpenCondition keyword for the ExpressionThresholds is the expression to be evaluated. If the expression returns 1 or TRUE then the threshold is open, if it is 0 or FALSE it is closed.
The AppointmentThreshold prevents the second doctor from treating patients with appointments while they are treating a Walk-Up patient. If the second doctor is currently treating a Walk-Up patient then the NumberInProgress output for the Doctor2Walkup object will be 1. Thus the AppointmentThreshold will be open if the NumberInProgress is < 1. Set the OpenCondition of AppointmentThreshold to be '[Doctor2Walkup].NumberInProgress < 1'. Then use this threshold as the OperatingThreshold of Doctor2Appointment by clicking on Doctor2Appointment > Thresholds > OperatingThresholdList > Value and selecting AppointmentThreshold.
The WalkupThreshold prevents the second doctor from treating Walk-Up patients while they are treating an Appointment patient OR if there are any Appointment patients waiting to be treated OR if the doctor treating Walk-Up patients (Doctor) is free. Hence, the WalkupThreshold is open if:
- the second doctor is not currently treating an Appointment patient
[Doctor2Appointment].NumberInProgress < 1; AND
- there are no Appointment patients waiting
[AppointmentQueue].QueueLength == 0; AND
- the doctor for Walk-Up patients (Doctor) is busy
[Doctor].NumberInProgress == 1
Set the OpenCondition of WalkupThreshold to be
'([Doctor2Appointment].NumberInProgress < 1) &&
 ([AppointmentQueue].QueueLength == 0) &&
 ([Doctor].NumberInProgress == 1)'
Set this to be the OperatingThreshold for Doctor2Walkup.
Return to top
Results
The health clinic is open 24/7, so we want to look at its steady state behaviour. We will perform 100 runs of this simulation each 168 hours long and with 24 hours warm up to examine the difference in average time in system and queue length for the walk up and appointment patients, and the difference in utilisation of the walk up only doctor and the appointment and walk up doctor. This can be achieved by editing the Simulation object as follows (note the last output in the RunOutputList has changed to include both Doctor2 Server objects):
| Object |
Key Inputs |
Value |
| Simulation |
RunDuration |
168 h |
| |
InitializationDuration |
24 h |
| |
UnitTypeList |
DimensionlessUnit TimeUnit TimeUnit DimensionlessUnit DimensionlessUnit |
| |
|
TimeUnit TimeUnit DimensionlessUnit DimensionlessUnit |
| |
RunOutputList |
{ [Simulation].RunIndex(1) } |
| |
|
{ [WaitingTime].SampleAverage } |
| |
|
{ [TimeInSystem].SampleAverage } |
| |
|
{ [WalkupQueue].QueueLengthAverage } |
| |
|
{ [Doctor].Utilisation } |
| |
|
{ [WaitingTime2].SampleAverage } |
| |
|
{ [TimeInSystem2].SampleAverage } |
| |
|
{ [AppointmentQueue].QueueLengthAverage } |
| |
|
{ '[Doctor2Appointment].Utilisation + [Doctor2Walkup].Utilisation' } |
Run your simulation and modify Lab2Analysis.R to use your new .dat file. Your results should be as below.
and your two sample t-test results should look as follows:
> t.test(Lab2scen$WalkUp.WaitingTime, Lab2scen$Appointment.WaitingTime)

        Welch Two Sample t-test

data:  Lab2scen$WalkUp.WaitingTime and Lab2scen$Appointment.WaitingTime
t = 9.8141, df = 121.6, p-value < 2.2e-16
alternative hypothesis: true difference in means is not equal to 0
95 percent confidence interval:
 0.02978398 0.04483608
sample estimates:
mean of x mean of y
0.1599199 0.1226099
|
> t.test(Lab2scen$WalkUp.TimeInSystem, Lab2scen$Appointment.TimeInSystem)

        Welch Two Sample t-test

data:  Lab2scen$WalkUp.TimeInSystem and Lab2scen$Appointment.TimeInSystem
t = 9.3346, df = 127.84, p-value < 4.084e-16
alternative hypothesis: true difference in means is not equal to 0
95 percent confidence interval:
 0.02959827 0.04552183
sample estimates:
mean of x mean of y
0.4435671 0.4060070
|
> t.test(Lab2scen$WalkUp.Queue, Lab2scen$Appointment.Queue)

        Welch Two Sample t-test

data:  Lab2scen$WalkUp.Queue and Lab2scen$Appointment.Queue
t = 9.6188, df = 116.33, p-value < 2.2e-16
alternative hypothesis: true difference in means is not equal to 0
95 percent confidence interval:
 0.09660161 0.14669869
sample estimates:
mean of x mean of y
0.4840191 0.3623689
|
> t.test(Lab2scen$Doctor.Utilisation, Lab2scen$Doctor2.Utilisation)

        Welch Two Sample t-test

data:  Lab2scen$Doctor.Utilisation and Lab2scen$Doctor2.Utilisation
t = -77.806, df = 128.08, p-value < 2.2e-16
alternative hypothesis: true difference in means is not equal to 0
95 percent confidence interval:
 -0.2616941 -0.2487141
sample estimates:
mean of x mean of y
0.6174519 0.8726559
|
Note that the performance of the system is quite different to the parallel scenario, but the run was over a longer duration. To make a valid comparison of the two service policies we need to run the parallel scenario over the same duration. Add a new scenario to Simulation
and set the ExpressionThresholds to only let Appointment patients see Doctor2 for scenario 5
| Object |
Key Inputs |
Value |
| AppointmentThreshold |
OpenCondition |
'[Simulation].RunIndex(1) == 5 ? 1 : [Doctor2Walkup].NumberInProgress < 1' |
| WalkupThreshold |
OpenCondition |
'[Simulation].RunIndex(1) == 5 ? 0 : ([Doctor2Appointment].NumberInProgress < 1) && ([AppointmentQueue].QueueLength == 0) && ([Doctor].NumberInProgress == 1)' |
Edit Lab2Analysis.R to do the same t-tests for this revised parallel scenario, i.e.,
Lab2scen = Lab2data[Lab2data$RunNumber == 5,]
and you will observe similar performance to the previous parallel scenario, but for the new simulation of 168 hrs with 24 hrs warm-up:
> t.test(Lab2scen$WalkUp.WaitingTime, Lab2scen$Appointment.WaitingTime)

        Welch Two Sample t-test

data:  Lab2scen$WalkUp.WaitingTime and Lab2scen$Appointment.WaitingTime
t = 29.014, df = 99.678, p-value < 2.2e-16
alternative hypothesis: true difference in means is not equal to 0
95 percent confidence interval:
 0.3479562 0.3990367
sample estimates:
 mean of x  mean of y
0.42845940 0.05496295
|
> t.test(Lab2scen$WalkUp.TimeInSystem, Lab2scen$Appointment.TimeInSystem)

        Welch Two Sample t-test

data:  Lab2scen$WalkUp.TimeInSystem and Lab2scen$Appointment.TimeInSystem
t = 28.612, df = 100.26, p-value < 2.2e-16
alternative hypothesis: true difference in means is not equal to 0
95 percent confidence interval:
 0.3464424 0.3980650
sample estimates:
mean of x mean of y
0.7113721 0.3391184
|
> t.test(Lab2scen$WalkUp.Queue, Lab2scen$Appointment.Queue)

        Welch Two Sample t-test

data:  Lab2scen$WalkUp.Queue and Lab2scen$Appointment.Queue
t = 26.197, df = 99.518, p-value < 2.2e-16
alternative hypothesis: true difference in means is not equal to 0
95 percent confidence interval:
 1.048803 1.220689
sample estimates:
mean of x mean of y
1.2967971 0.1620511
|
> t.test(Lab2scen$Doctor.Utilisation, Lab2scen$Doctor2.Utilisation)

        Welch Two Sample t-test

data:  Lab2scen$Doctor.Utilisation and Lab2scen$Doctor2.Utilisation
t = 2.4919, df = 114.73, p-value = 0.01413
alternative hypothesis: true difference in means is not equal to 0
95 percent confidence interval:
 0.001967653 0.017220045
sample estimates:
mean of x mean of y
0.7502284 0.7406345
|
The scenario in which Doctor2 is shared rather than used in parallel for Appointment patients only results in a much “fairer” patient experience for Walk-Up and Appointment patients (0.443 vs 0.406 when sharing Doctor2 as compared with 0.711 vs 0.339 when using Doctor2 in parallel).
Return to top
Conclusions
In this case study, you extended the Simple Health Clinic model to include patients with appointments. You added another doctor to treat these patients and experimented with policies for the new doctor to investigate the efficacy of their help with walk-up patients. The two policies (parallel vs shared utilisation of the new doctor) could be evaluated by looking at the difference in patient experience (between Walk-Up and Appointment patients) under each policy.
What about staff workload? What do your experiments show for the two doctors?
Return to top
<--

-->
<--

-->
|*FORM FIELD ProblemDescription*|ProblemDescription|This case study extends the Simple Health Clinic (SHC) model. In that case study walk-up patents waited for treatment by a doctor. In this case study an additional doctor is present in the clinic, one that sees patients with scheduled appointments. The second doctor can also treat walk up patients if they are free.
The goal of this simulation study is to analyse the average time patients spend:
- waiting for treatment; and
- in the clinic;
and the average length of the patient queue (which informs waiting room size). This analysis will include a comparison of the walk-up vs scheduled patients.
|
|*FORM FIELD ProblemFormulation*|ProblemFormulation|In order to formulate a simulation model we specify the following components:
- Background – problem description
- Objectives of the study
- Expected benefits
- The CM: inputs, outputs, content, assumptions, simplifications’
- Experiments to run
Components 1(Background – problem description) and 2 (Objectives of the study) are given in the Problem Description section (see paragraph describing the goal of the simulation study to identify study objectives).
The Expected benefits (component 3) are a virtual environment for evaluating patient waiting times, total time patients spend in the clinic, and the number of patients waiting for treatment. This environment can be used to experiment with changes to the clinic, including a comparison of effects on the waiting times, queue length, etc for the walk-up vs the scheduled patients.
The CM content is specified using the following components:
- Component List
- Process flow diagram
- Logic flow diagram
- Activity cycle diagram
Component List
The components of the Simple Health Clinic model are:
- Walk-up patients with their (inter)arrival times
- Scheduled patients with their appointment times
- Doctors with their treatment times
- Waiting room with its capacity
Process Flow Diagram
| Patient Logic Flow Diagram | | Doctor Logic Flow Diagrams |
| | |
Activity Cycle Diagram
Once the content has been established (note this is usually an iterative process) we can identify the inputs and outputs: appointment times, interarrival times, treatment times, waiting times (Patient arrives to Doctor sees patient), total clinic time (Patient arrives to Outside), number in waiting room.
Assumptions are used to define stochasticity (e.g., Exponential interarrivals, Triangular treatment times) and the simplifications keep the system simple (e.g., one doctor on all day, no registration, no prioritisation).
|
| FORM FIELD ComputationalModel |
ComputationalModel |
The computational model... |
| FORM FIELD Results |
Results |
The results... |
| FORM FIELD Conclusions |
Conclusions |
In conclusion... |
| FORM FIELD ExtraForExperts |
ExtraForExperts |
| FORM FIELD StudentTasks |
StudentTasks |
| META FILEATTACHMENT |
attachment="ProcessFlowDiagram.png" attr="h" comment="" date="1505018691" name="ProcessFlowDiagram.png" path="ProcessFlowDiagram.png" size="13890" stream="ProcessFlowDiagram.png" tmpFilename="/var/tmp/CGItemp12683" user="MichaelOSullivan" version="1" |
| META FILEATTACHMENT |
attachment="PatientLogicFlowDiagram.png" attr="h" comment="" date="1505018736" name="PatientLogicFlowDiagram.png" path="PatientLogicFlowDiagram.png" size="11736" stream="PatientLogicFlowDiagram.png" tmpFilename="/var/tmp/CGItemp12573" user="MichaelOSullivan" version="1" |
| META FILEATTACHMENT |
attachment="DoctorLogicFlowDiagram.png" attr="h" comment="" date="1505018748" name="DoctorLogicFlowDiagram.png" path="DoctorLogicFlowDiagram.png" size="16399" stream="DoctorLogicFlowDiagram.png" tmpFilename="/var/tmp/CGItemp12590" user="MichaelOSullivan" version="1" |
| META FILEATTACHMENT |
attachment="ActivityCycleDiagram.png" attr="h" comment="" date="1505018763" name="ActivityCycleDiagram.png" path="ActivityCycleDiagram.png" size="20001" stream="ActivityCycleDiagram.png" tmpFilename="/var/tmp/CGItemp12334" user="MichaelOSullivan" version="1" |
|