Case Study: Simple Health Clinic – Scheduled Appointments
Submitted: 10 Sep 2017
Operations Research Topics: SimulationModelling
Application Areas: Healthcare
Contents
Problem Description
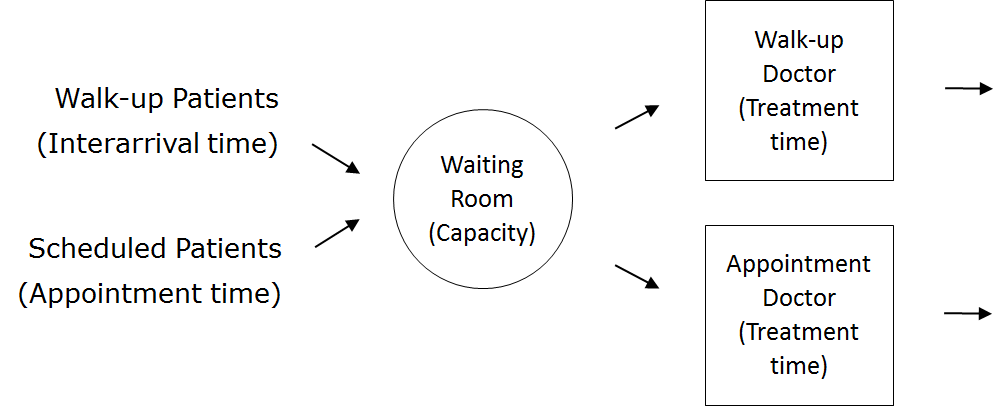
This case study extends the Simple Health Clinic (SHC) model. In that case study walk-up patents waited for treatment by a doctor. In this case study an additional doctor is present in the clinic, one that sees patients with scheduled appointments. The second doctor can also treat walk up patients if they are free. The goal of this simulation study is to analyse the average time patients spend:- waiting for treatment; and
- in the clinic;
Problem Formulation
In order to formulate a simulation model we specify the following components:- Background – problem description
- Objectives of the study
- Expected benefits
- The CM: inputs, outputs, content, assumptions, simplifications’
- Experiments to run
- Component List
- Process flow diagram
- Logic flow diagram
- Activity cycle diagram
- Walk-up patients with their (inter)arrival times
- Scheduled patients with their appointment times
- Doctors with their treatment times
- Waiting room with its capacity
| Patient Logic Flow Diagram | Doctor Logic Flow Diagrams | |
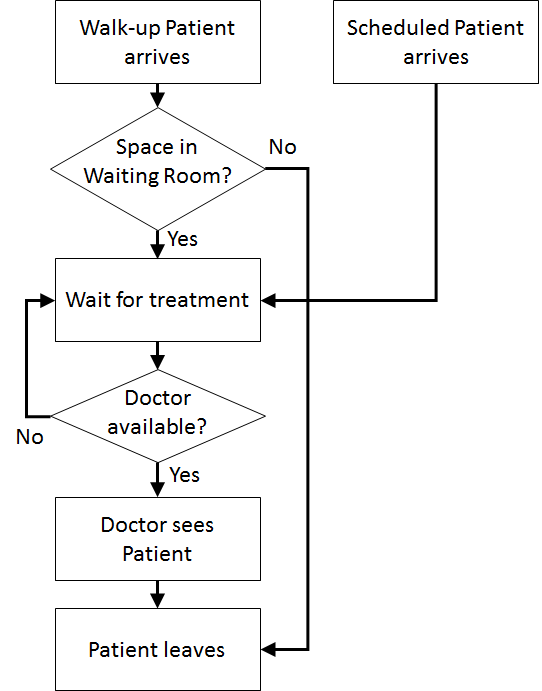 | 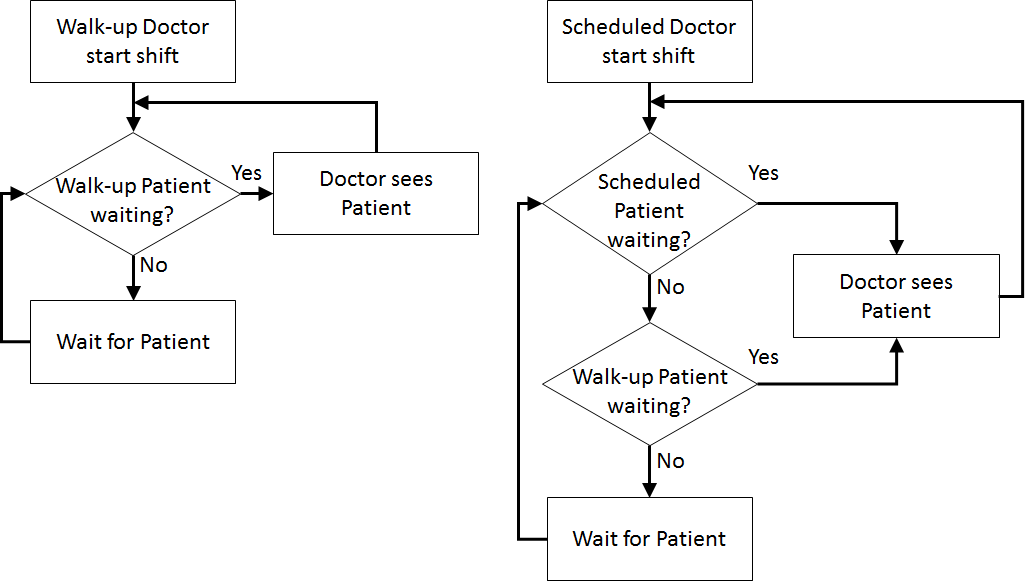 |
 Once the content has been established (note this is usually an iterative process) we can identify the inputs and outputs: appointment times, interarrival times, treatment times, waiting times (Patient arrives to Doctor sees patient), total clinic time (Patient arrives to Outside), number in waiting room.
Assumptions are used to define stochasticity (e.g., Exponential interarrivals, Triangular treatment times) and the simplifications keep the system simple (e.g., one doctor on all day, no registration, no prioritisation).
Return to top
Once the content has been established (note this is usually an iterative process) we can identify the inputs and outputs: appointment times, interarrival times, treatment times, waiting times (Patient arrives to Doctor sees patient), total clinic time (Patient arrives to Outside), number in waiting room.
Assumptions are used to define stochasticity (e.g., Exponential interarrivals, Triangular treatment times) and the simplifications keep the system simple (e.g., one doctor on all day, no registration, no prioritisation).
Return to top
Computational Model
The computational model... Return to topResults
The results... Return to topConclusions
In conclusion... Return to topTopic revision: r1 - 2017-09-10 - MichaelOSullivan

|
|
|
|
Ideas, requests, problems regarding TWiki? Send feedback