Case Study: Simple Health Clinic Model
Submitted: 24 Jul 2017
Application Areas: Healthcare
Contents
Problem Description
In a simple model of a health clinic, patients arrive, wait to receive treatment, receive treatment, and leave.
Common questions asked by clinic management are: "How long do our patients wait before being seen? How long are they at the clinic? How big does my waiting room need to be? ".
In this case study we are going to consider a simple health clinic model in which patients arrive every 20 mins on average. Once the doctor is ready to see them they take 2 minutes getting to the doctor’s office and treatment takes between 5 and 30 minutes, with the usual treatment time of 10 minutes and the average treatment time of 15 minutes.
The goal of this simulation study is to analyse the effects of different arrival and service distributions on the average time patients spend:
- waiting for treatment; and
- in the clinic;
and the average length of the patient queue (which informs waiting room size).
Return to top
Problem Formulation
In order to formulate a simulation model we specify the following components:
- Background – problem description
- Objectives of the study
- Expected benefits
- The CM: inputs, outputs, content, assumptions, simplifications
- Experiments to run
Components 1 (Background – problem description) and 2 (Objectives of the study) are given in the
Problem Description section (see paragraph describing the goal of the simulation study to identify study objectives).
The Expected benefits (component 3) are a virtual environment for evaluating patient waiting times, total time patients spend in the clinic, and the number of patients waiting for treatment. This environment can be used to experiment with changes to the clinic, including the effect of variability in arrivals and treatment times.
The CM content is specified using the following components:
- Component List
- Process flow diagram
- Logic flow diagram
- Activity cycle diagram
Component List
The components of the Simple Health Clinic model are:
- Patients with their (inter)arrival times
- Doctor with their treatment times
- Waiting room with its capacity
Process Flow Diagram
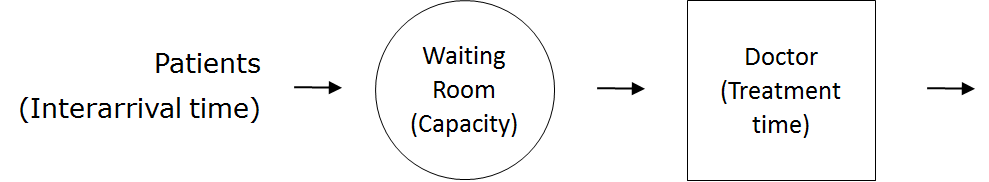
| Logic Flow Diagram | | Activity Cycle Diagram |
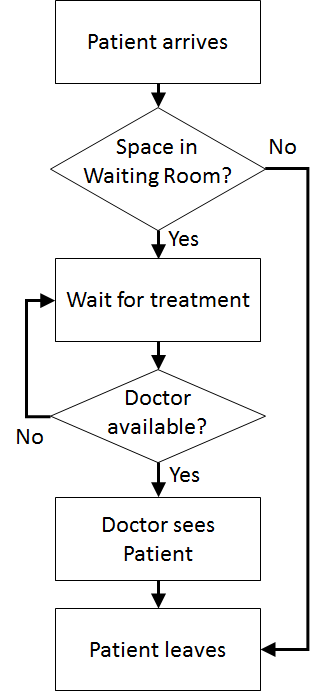 | | 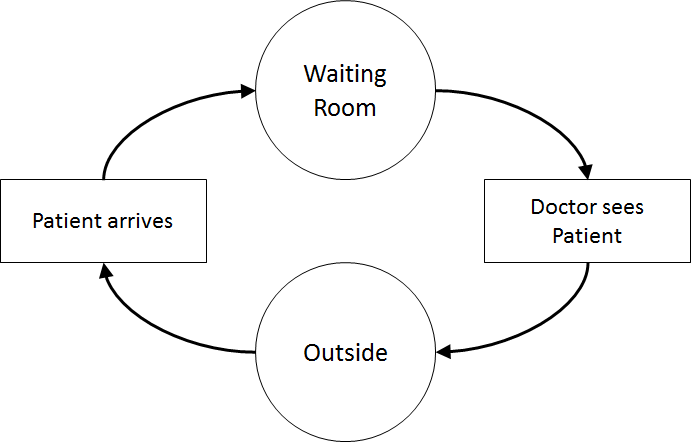 |
Once the content has been established (note this is usually an iterative process) we can identify the inputs and outputs: interarrival times, treatment times, waiting times (Patient arrives to Doctor sees patient), total clinic time (Patient arrives to Outside), number in waiting room.
Assumptions are used to define stochasticity (e.g., Exponential interarrivals, Triangular treatment times) and the simplifications keep the system simple (e.g., one doctor on all day, no registration, no prioritisation).
Return to top
Computational Model
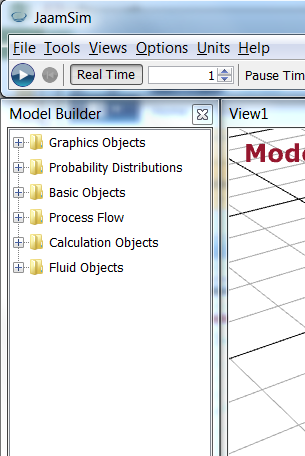
We use the latest version of JaamSim to implement our conceptual model. Download the JaamSim executable from
jaamsim.com/downloads.html
. Next, run the JaamSim executable (JaamSim<year>-<version>.exe).
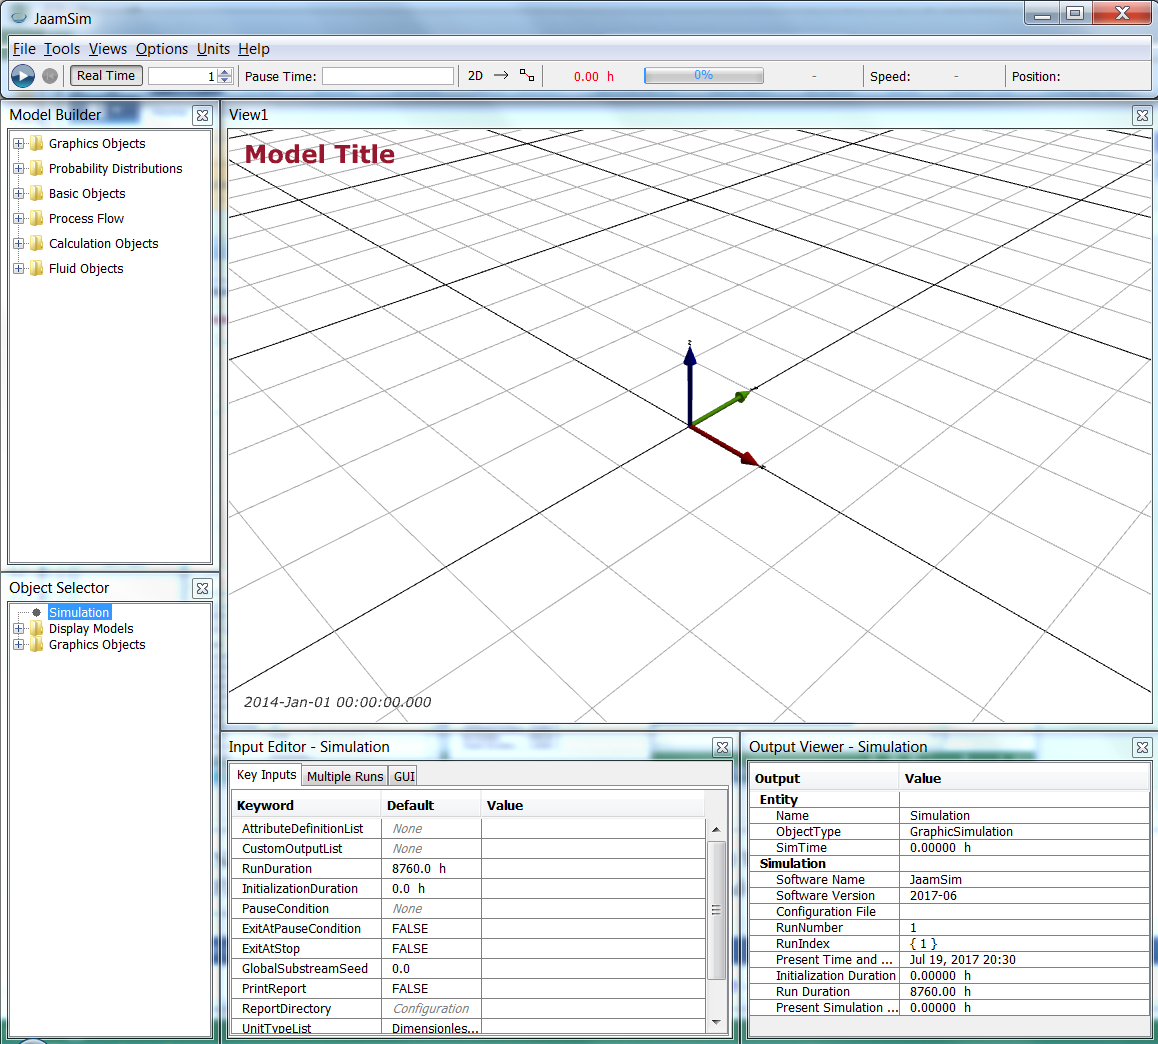
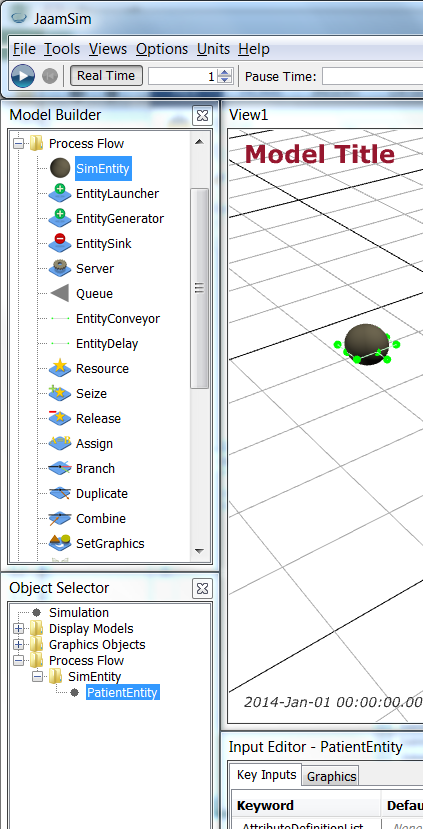
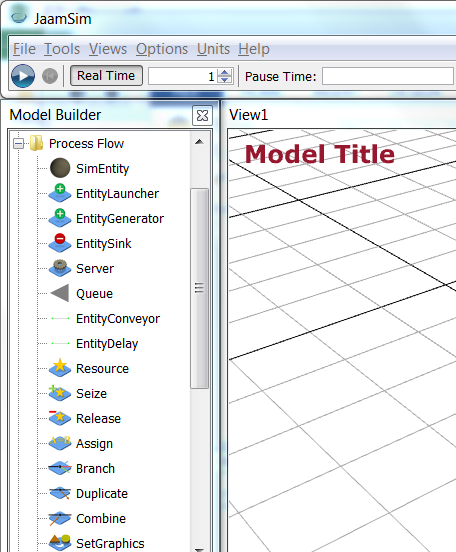
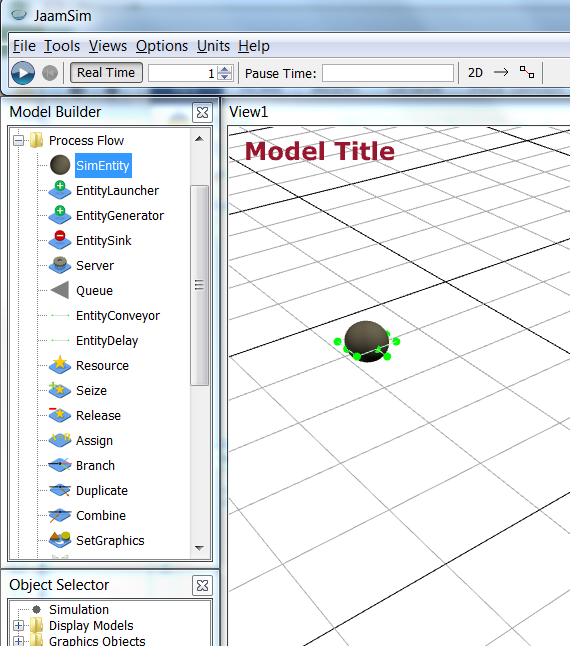
Next, we create the components: Patients; Doctor; and Waiting room. We expand the Process Flow model palette (in the Model Builder) window and drag the SimEntity object onto the view (View1 window).
Note To move objects within the View1 window with the mouse, hold down Ctrl and click on the object with the left mouse button. Keep the mouse button down when moving the object around.
Then, select SimEntity1 from the Process Flow > SimEntity object list in the Object Selector window and wait briefly until you can change the name of the object to PatientEntity.
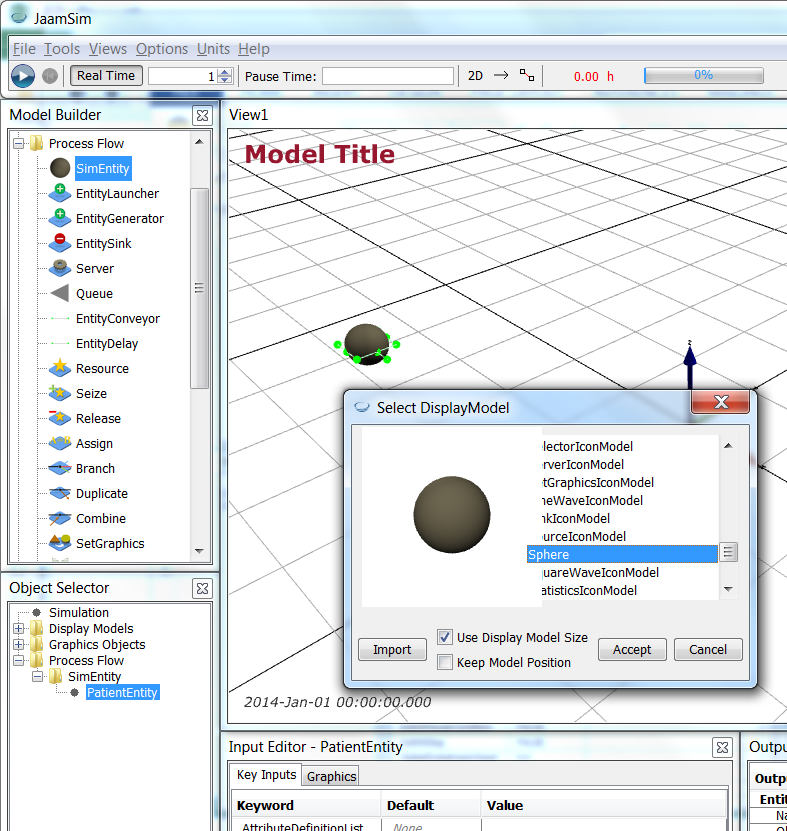
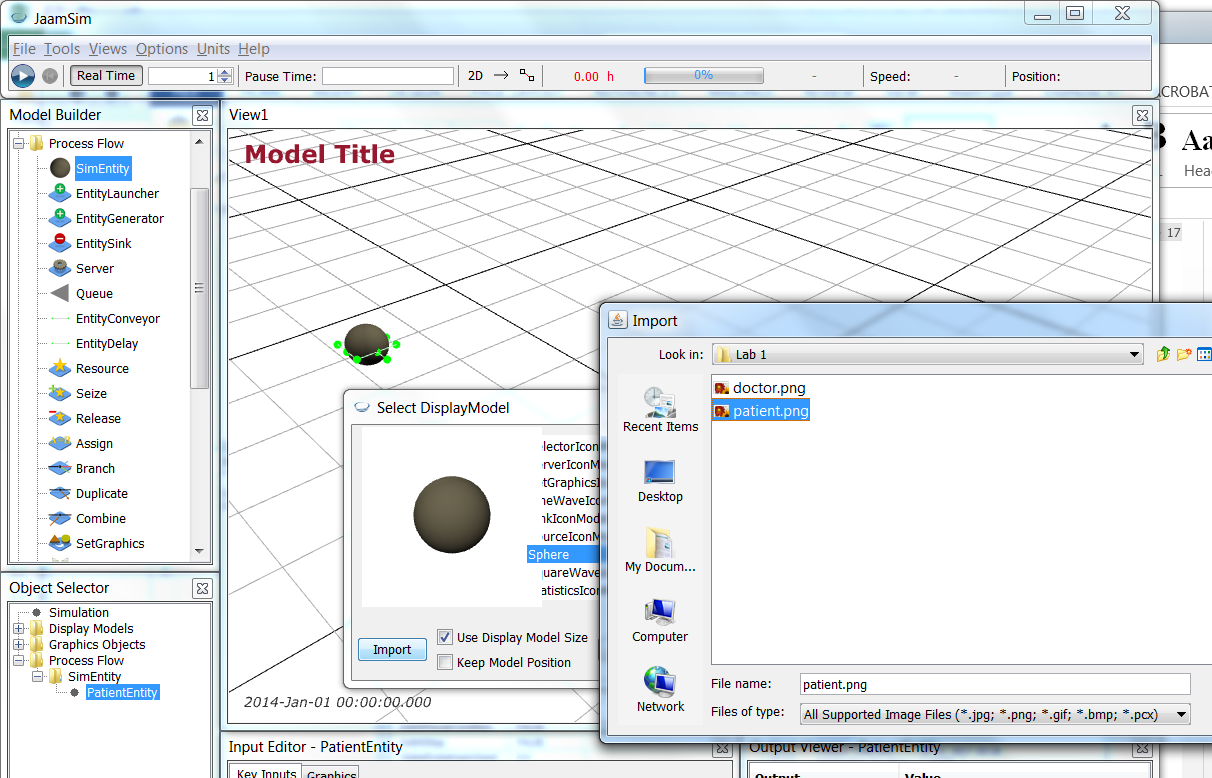
Now, we want an image to use for a patient. Download
patient.png (icon made by Freepik from
www.flaticon.com). Then, right click on PatientEntity and select Change Graphics. Click on Import and navigate to your downloaded
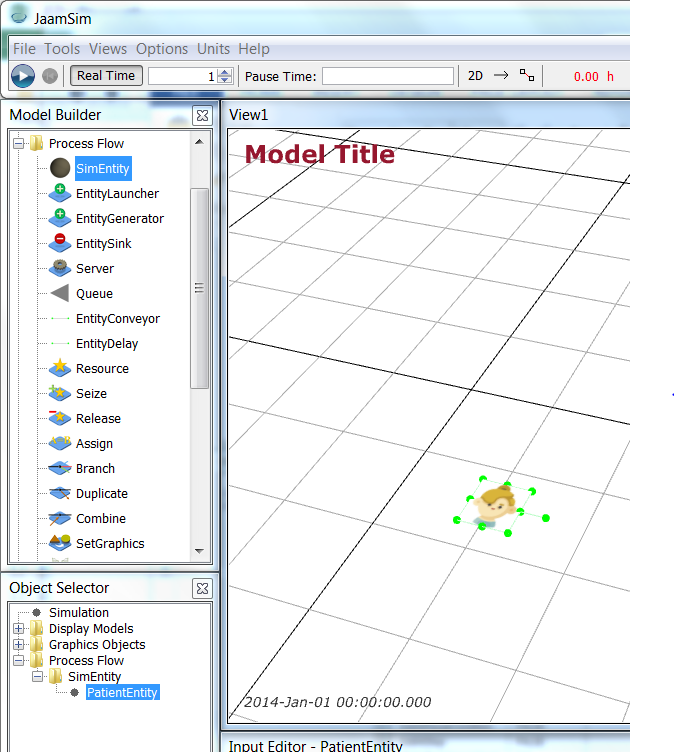
patient.png, import it (it may be called patient-model) and accept the change. (In some cases you may need to cancel out of the Change Graphics dialog and try again if the patient-model selection is not present.) You will see
patient.png looking a little “flattened” as it is essentially a “tile” in 3D.
Save your simulation (it will create a .cfg file that can be loaded into JaamSim).
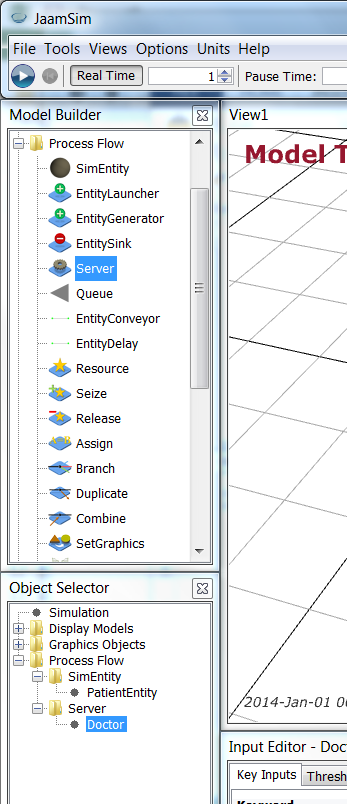
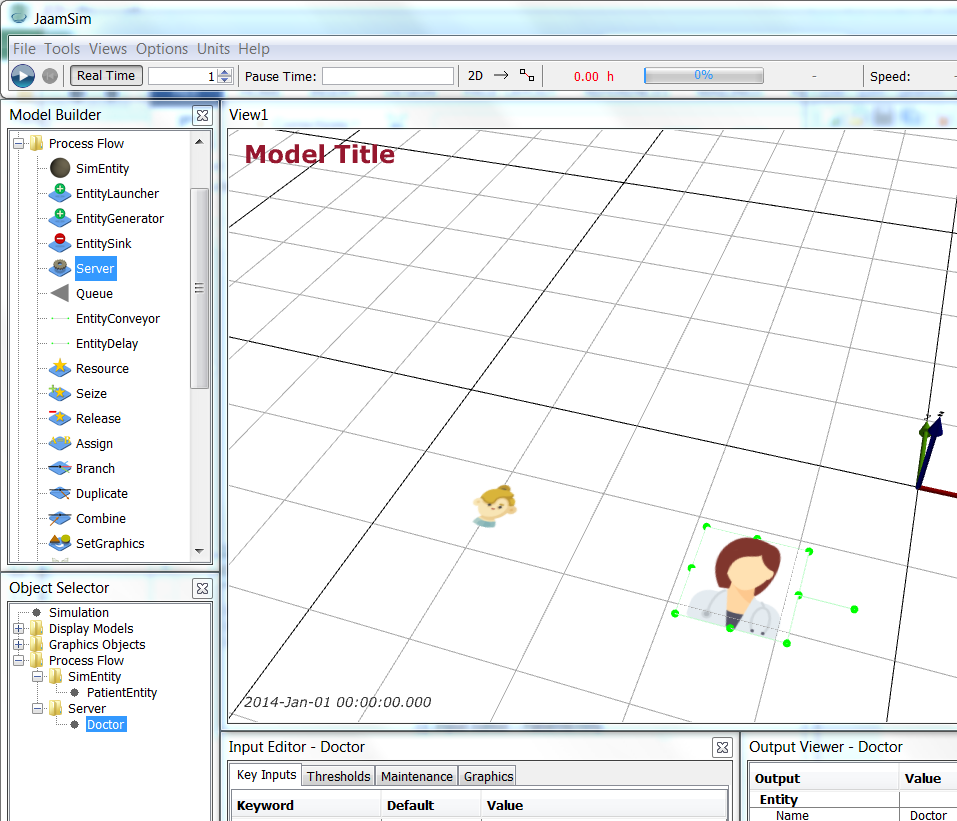
Next, we add the Doctor. Go back to the Process Flow model palette (in the Model Builder window) and drag a Server object onto the View1 window.
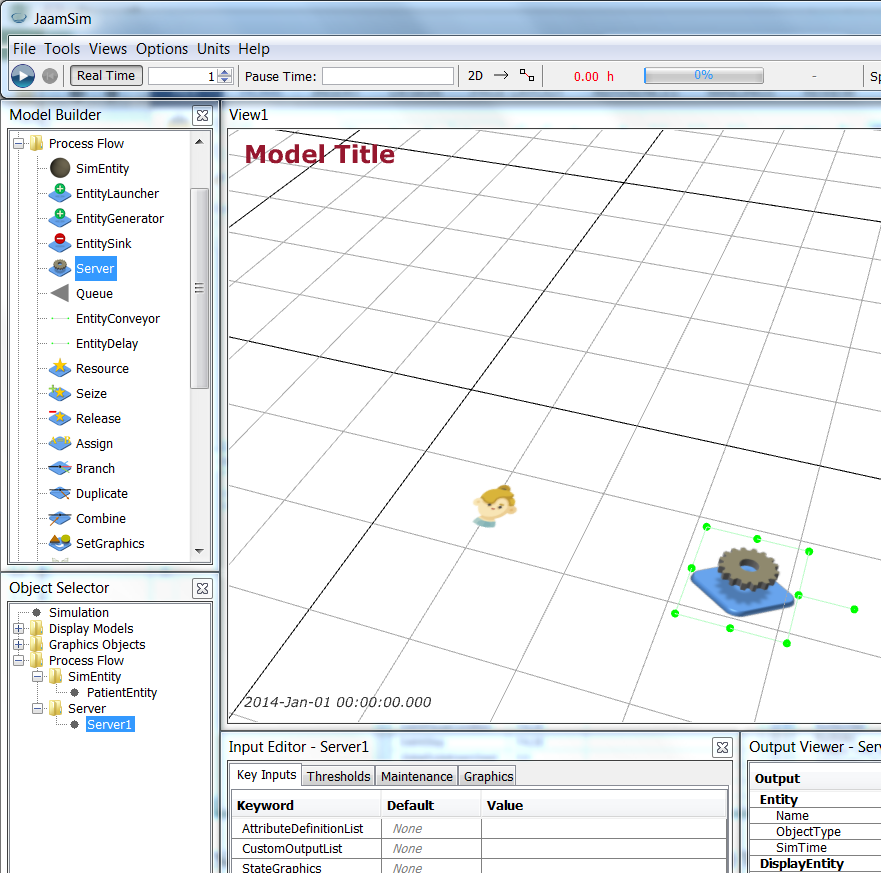
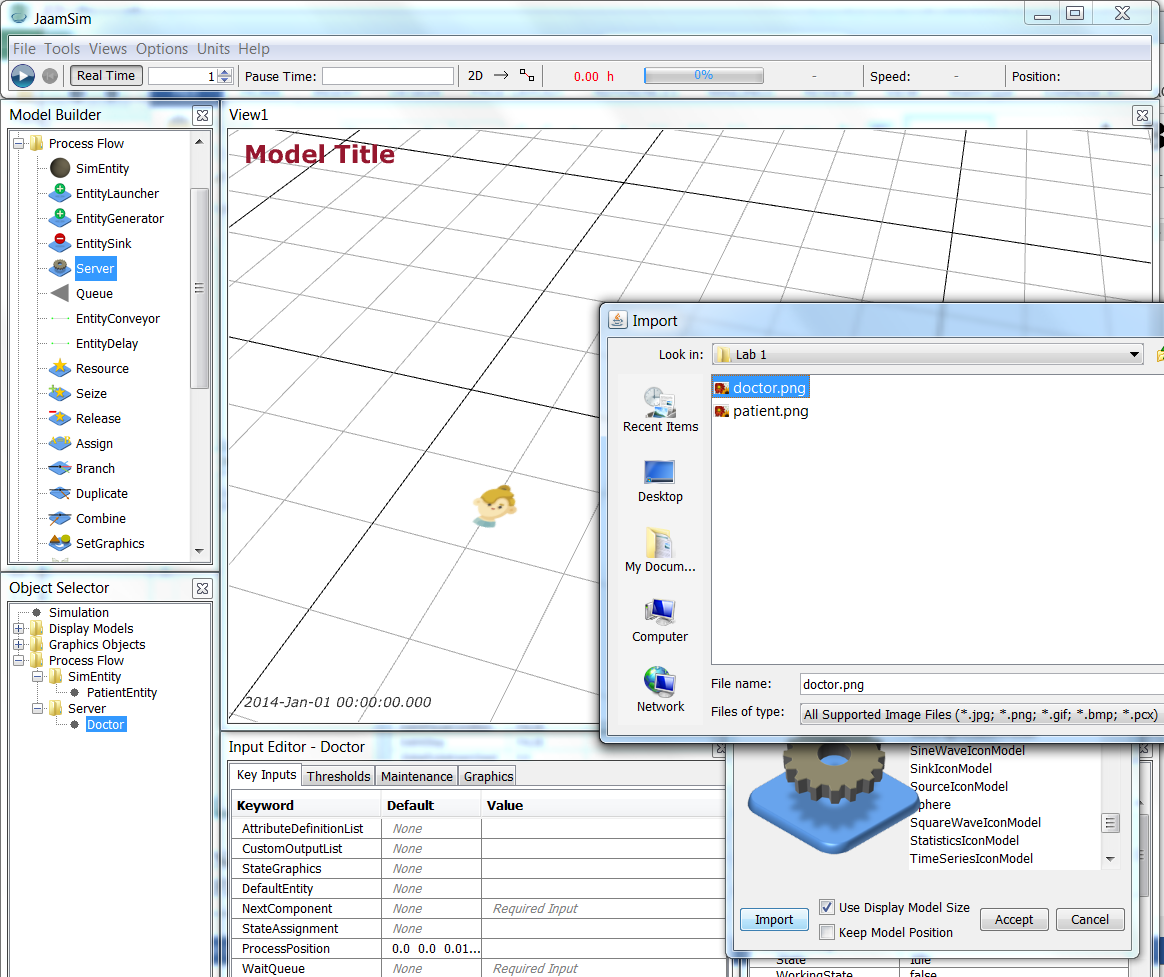
Now change the name of the Server to be Doctor, download the
doctor.png (icon made by Freepik from
www.flaticon.com), and change the Doctor graphics to be
doctor.png. (Remember that it will be imported as doctor-model and, in some cases, you may need to cancel out of the Change Graphics dialog and try again if the doctor-model selection is not present.)
Save your simulation.
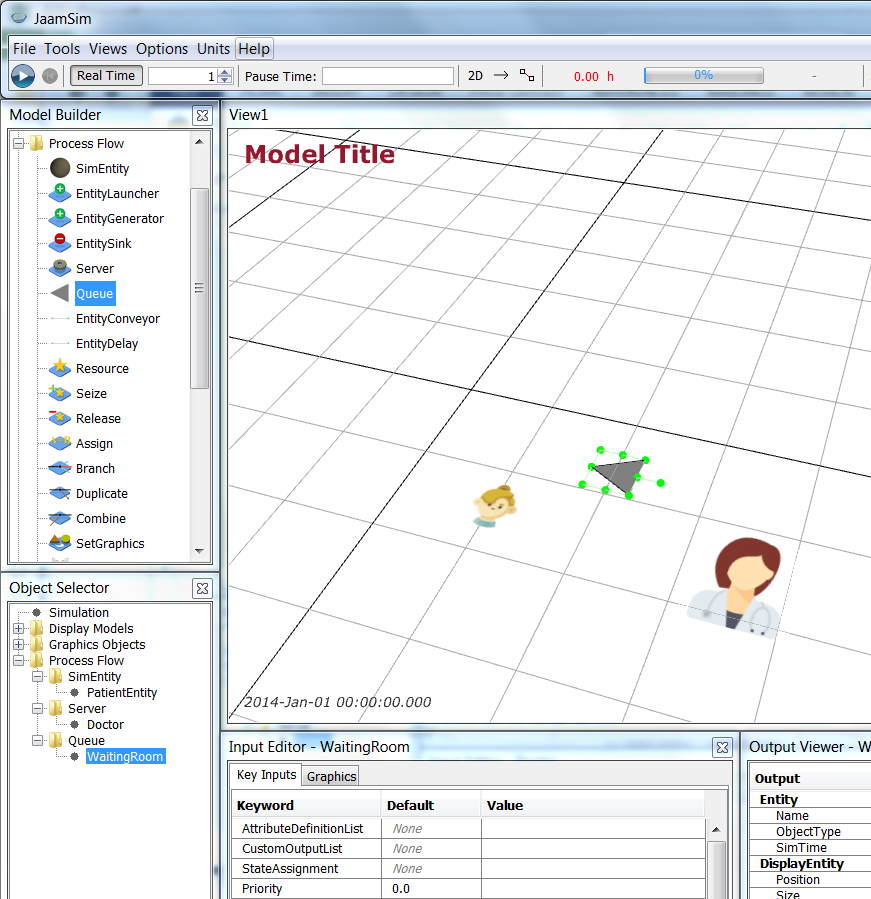
Finally, add the Waiting Room by adding a Queue from the Process Flow model palette and renaming it WaitingRoom.
Save your simulation.
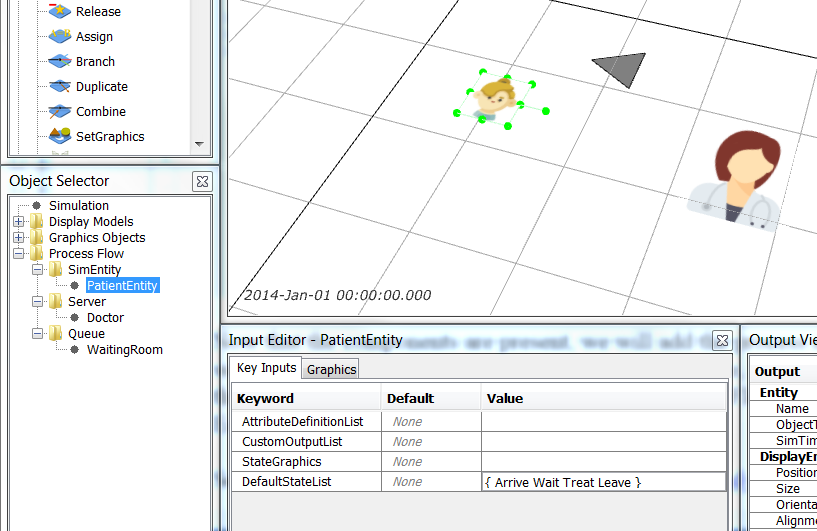
Now that the components are present, we will add the process and logic to the model. First, we want to observe the PatientEntity in 4 states: Arrive, Wait, Treat, and Leave. We click on the PatientEntity object (in Object Selector > Process Flow > SimEntity), go to the Input Editor and enter the set of patient states { Arrive Wait Treat Leave }.
We have finished our definition of the model components, so we turn to the Simple Health Clinic process flow.
From the Process Flow palette we add an EntityGenerator, EntitySink, and 2 × EntityConveyors. We name these objects PatientGenerator, PatientSink, ArriveToTreat, and TreatToLeave respectively.
Once you have added objects, the easiest way to get them positioned properly is to edit the Graphics > Position in the Input Editor window. Edit the positions or points’ positions (for the EntityConveyors) as follows:
| Object |
Graphics |
| PatientEntity |
Position = -1 1 0 m, Alignment = 0 0 0 |
| PatientGenerator |
Position = 1 1.5 0 m |
| PatientSink |
Position = 5.5 1.5 0 m |
| Doctor |
Position = 3.5 1.5 0 m |
| WaitingRoom |
Position = 3.5 0.5 0 m |
| ArriveToTreat |
Points = { 1 1.5 0.000 m } { 3 1.5 0.000 m }, DisplayModel = ArrowModelDefault |
| TreatToLeave |
Points = { 4 1.5 0.000 m } { 5 1.5 0.000 m }, DisplayModel = ArrowModelDefault |
The layout of the model should look like
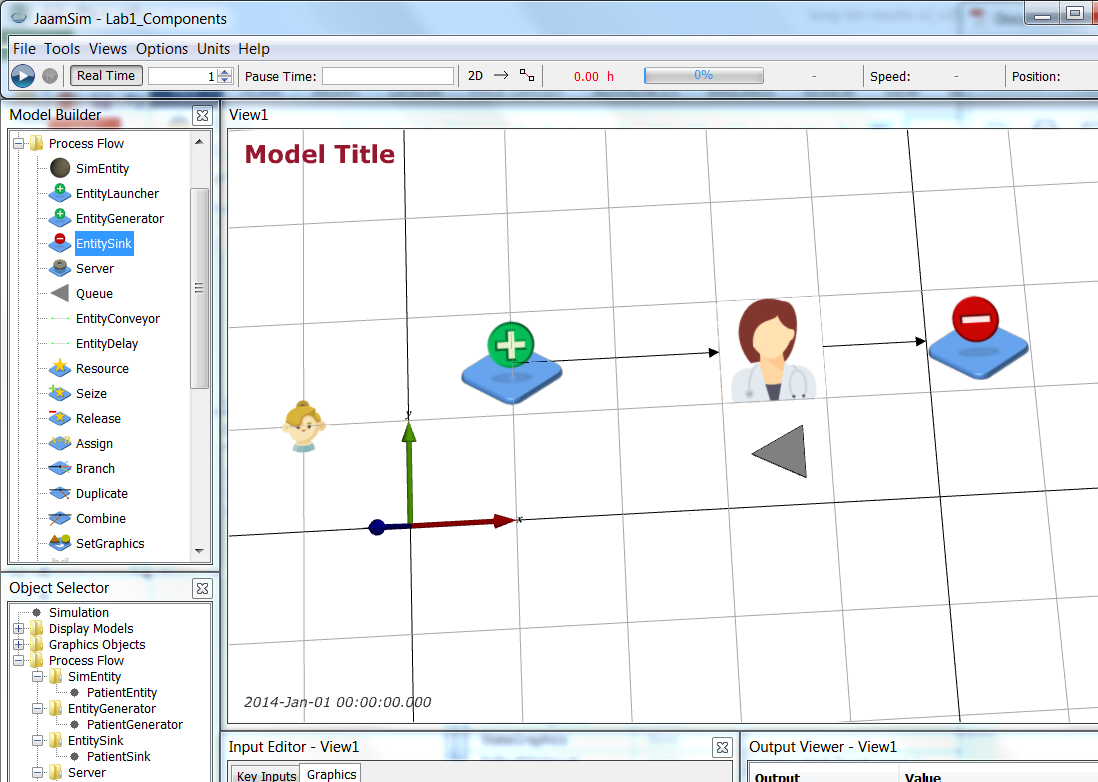
Save your simulation.
Now the process flow has been completed, we need to define the logic flow.
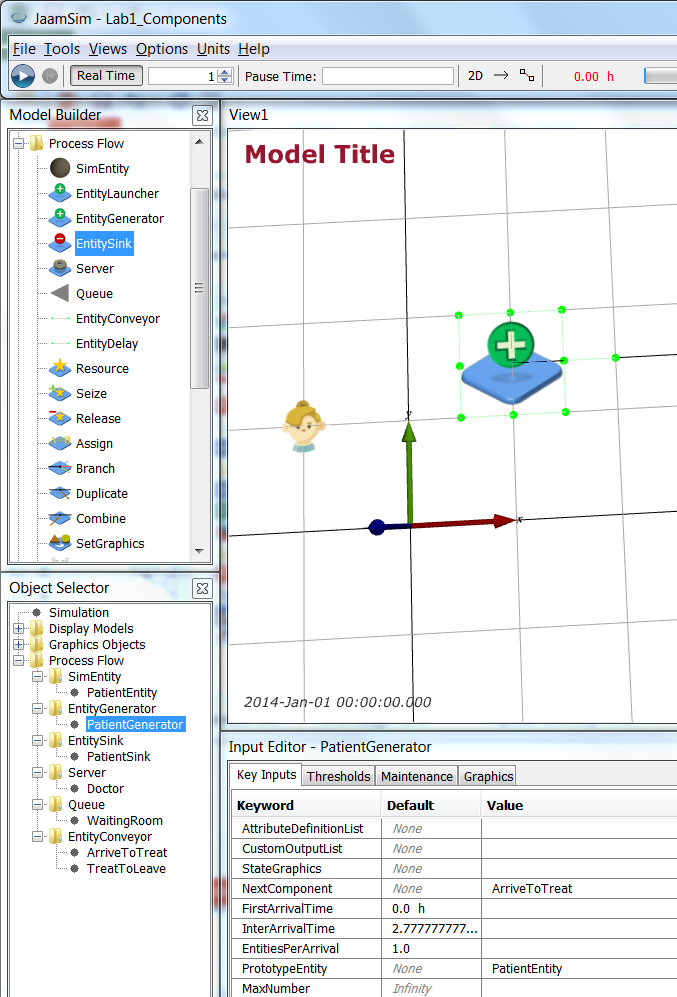
This is achieved by setting the entity type generated by PatientGenerator, NextComponent on the objects and also defining how the WaitingRoom queue is used. We also track the state of entities using StateAssignment of various objects.
Edit the Key Inputs of the objects (in the Input Editor window) as follows:
| Object |
Key Inputs |
| PatientGenerator |
PrototypeEntity = PatientEntity, NextComponent = ArriveToTreat |
| Doctor |
NextComponent = TreatToLeave, WaitQueue = WaitingRoom, StateAssignment = Treat |
| WaitingRoom |
StateAssignment = Wait |
| ArriveToTreat |
NextComponent = Doctor, StateAssignment = Arrive |
| TreatToLeave |
NextComponent = PatientSink, StateAssignment = Leave |
Save your simulation.
Now that the process and logic flows are complete, we need to put data into our model. We set the first arrival time, interarrival time, service time and travel times of the objects.
| Object |
Key Inputs |
| PatientGenerator |
FirstArrivalTime = 20 min, InterArrivalTime = 20 min |
| Doctor |
ServiceTime = 15 min |
| ArriveToTreat |
TravelTime = 2 min |
| TreatToLeave |
TravelTime = 2 s |
Save your simulation.
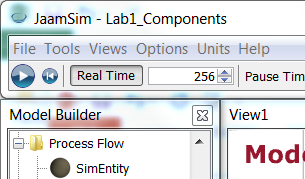
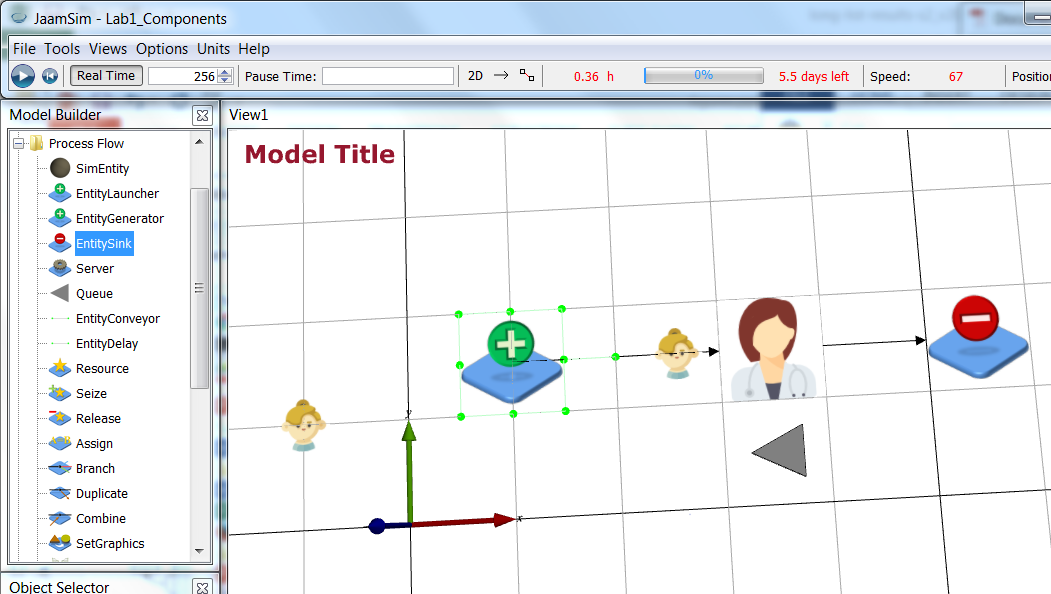
Finally, you can run your model and see patients arriving and being treated by the doctor. Click on the run icon and set the speed up to be 256. (Note, if you re-run your model you will need to use the reset button

, otherwise your model will start running from when it stopped and run forever!)
Save your simulation.
Now that your simulation is running, we need to collect statistics (our outputs) and also set the simulation up to run multiple replications.
Drag 2 × Statistics component from the Process Flow model palette to the View1 window and name them TimeInSystem and WaitingTime. Insert them between the TreatToLeave and PatientSink objects by making the following changes:
| Object |
Graphics |
Key Inputs |
| TreatToLeave |
|
NextComponent = TimeInSystem |
| TimeInSystem |
Position = 5.5 1.5 0 m |
NextComponent = WaitingTime |
| WaitingTime |
Position = 6.5 1.5 0 m |
NextComponent = PatientSink |
| PatientSink |
Position = 7.5 1.5 0 m |
|
Set the UnitType for both Statistics objects to be TimeUnit and the SampleValue to be
'this.obj.StateTimes("Arrive") + this.obj.StateTimes("Wait") + this.obj.StateTimes("Treat") + this.obj.StateTimes("Leave")'
(that is the total time for patients in the clinic) for TimeInSystem and
'this.obj.StateTimes("Wait")'
(that is waiting time) for WaitingTime.
Now, to set up the simulation model to do multiple replications, we edit the Simulation object (at the top of the Object Selector window). We set Key Inputs as follows:
| Object |
Key Inputs |
Value |
| Simulation |
RunDuration |
24 h |
| |
GlobalSubstreamSeed |
[Simulation].RunIndex(2) |
| |
UnitTypeList |
DimensionlessUnit TimeUnit TimeUnit DimensionlessUnit |
| |
RunOutputList |
{ [Simulation].RunIndex(1) } { [WaitingTime].SampleAverage } { [TimeInSystem].SampleAverage } { [WaitingRoom].QueueLengthAverage } |
This uses the second element of the simulation RunIndex (the replication number) as the random seed for the replication, sets the output units as dimensionless, time, time and dimensionless respectively, and sets the outputs as the first element of the RunIndex (the run number), the average patient waiting time, the average patient time in the clinic, and the average number of patients in the waiting room.
Set up the replications as follows:
Save your simulation.
Now when you run your simulation (remember, if you re-run your model you will need to use the reset button
, otherwise your model will start running from when it stopped and run forever!), click on the Real Time button to disable it and your simulation will run without animation, but it will create a data file with the same name as your .cfg file but with a .dat extension. Open this file in Notepad++, does it make sense? Explain why/why not to one of your lab tutors.
Save your simulation.
Now our simulation is running with deterministic values we are going to add stochasticity to both arrivals and service and run 4 different models with all combinations:
- Deterministic arrivals and deterministic service (just completed);
- Stochastic arrivals and deterministic service;
- Deterministic arrivals and stochastic service;
- Stochastic arrivals and stochastic service.
First, add an ExponentialDistribution and a TriangularDistribution from the Probability Distributions model palette. Name them ArrivalDist and TreatmentDist respectively. Set their parameters as follows:
| Object |
Key Inputs |
| ArrivalDist |
UnitType = TimeUnit, Mean = 20 min |
| TreatmentDist |
UnitType = TimeUnit, MinValue = 5 min, MaxValue = 30 min, Mode = 10 min |
Now, set 4 runs of 10 replications each in the Simulation’s Multiple Runs:
Lastly, set the arrival and service times to be conditional on the run number - RunIndex(1). To do this we use the conditional expression
<conditional expression> ? <true expression> : <false expression>
| Object |
Multiple Runs |
Value |
| PatientGenerator |
FirstArrivalTime |
'([Simulation].RunIndex(1) == 1) || ([Simulation].RunIndex(1) == 3) ? 20[min] : [ArrivalDist].Value' |
| |
InterArrivalTime |
'([Simulation].RunIndex(1) == 1) || ([Simulation].RunIndex(1) == 3) ? 20[min] : [ArrivalDist].Value' |
| Doctor |
ServiceTime |
'([Simulation].RunIndex(1) == 1) || ([Simulation].RunIndex(1) == 2) ? 15[min] : [TreatmentDist].Value' |
Save your simulation.
Now run the simulation (remember, if you re-run your model you will need to use the reset button
, otherwise your model will start running from when it stopped and run forever!) with Real Time turned off again and look at your .dat file. Does it make sense now?
Return to top
Results
Now your model is complete, you can use R to analyse your results.
- Download the R analysis file - Lab1Analysis.R;
- In the analysis file, set the directory to be the directory where your .dat file sits;
- Run the R file.
It will give you confidence intervals for average patient waiting time for treatment, average total patient time in the clinic, and the average number of patients in the waiting room. Your results should look as follows:
> aggregate(.~Configuration,data=Lab1data, mean)
  Configuration WaitingTime TimeInSystem QueueLength
1             1  0.00000000    0.2838889    0.000000
2             2  0.32784818    0.6117371    1.067857
3             3  0.01569253    0.2949375    0.046549
4             4  0.34244844    0.6219432    1.139801
>
> aggregate(.~Configuration,data=Lab1data, FUN = function(x) {
+   tTest = try(t.test(x), silent=TRUE)
+   if (is(tTest, "try-error")) {
+     interval = c(mean(x), mean(x))
+     return(interval)
+   } else {
+     if (is.na(tTest$conf.int[1])) {
+       return(c(mean(x), mean(x)))
+     } else {
+       return(tTest$conf.int)
+     }
+   }
+ })
  Configuration WaitingTime.1 WaitingTime.2 TimeInSystem.1 TimeInSystem.2 QueueLength.1 QueueLength.2
1             1    0.00000000    0.00000000      0.2838889      0.2838889    0.00000000    0.00000000
2             2    0.18453128    0.47116509      0.4684202      0.7550540    0.47479351    1.66092016
3             3    0.01146819    0.01991687      0.2880446      0.3018305    0.03410567    0.05899233
4             4    0.15742717    0.52746971      0.4366125      0.8072738    0.34678562    1.93281707
Is variability in patient arrivals or treatment time the most important in your model? Justify your answer to a lab tutor.
Return to top
Conclusions
In this case study, you developed simulation model of a Simple Health Clinic. You defined a conceptual model and used it to implement your simulation model in JaamSim. You added variability and tested the effect of that variability on the system. The key inputs were the arrival times and corresponding distribution and the treatment times and their distribution. The key outputs were the average patient waiting time for treatment, the average total time a patient spends in the clinic, and the average number of patients in the waiting room. The effect of variability on the key outputs was observed across multiple replications and confidence intervals were constructed to enable comparison across different combinations of variability.
Are the key outputs appropriate? Justify your answer to a lab tutor.
Note that the Queue object in JaamSim has a property [QueueName].QueueLengthMaximum. Given your previous answer, how could this be used?
Return to top


