Case Study: Buffering Data for a Link
Submitted: 26 Jul 2009
Application Areas: Telecommunications Networks
Contents
Problem Description
When data is transmitted on a computer network, it must leave the component, e.g., server, switch, PC, via a connection, e.g., network interface card (NIC), port, host-bus adapter (HBA), and be transmitted across a
link to another component. The output connection must
buffer data (i.e., store the data in some memory) if the link is already being used by another piece of data. This is known as
output buffering.
One common question asked by network engineers is: "How big does my output buffer need to be so I don't lose data very often?".
In this case study we are going to consider data being sent from a server, via a NIC and ethernet link, to some data storage. The data gets split into packets and transmitted across the link. The size of the data determines the number of packets and, thus, the time the link needs to send the data.
The data being generated on the server is video being compressed before being sent. The time between transmissions is exponentially distributed with mean 1 minute. The size of the data follows a triangular distribution with minimum 3.75GB, mode 7.5GB and maximum 11.25GB. Given that the ethernet link has 1 Gbps of bandwidth and there are 8 bits in a byte, the transmission times also follow a triangular distribution with minimum 0.5 mins, mode 1 min and maximum 1.5 mins.
The goal of this simulation study is to find the average buffer size required in bytes.
Return to top
Problem Formulation
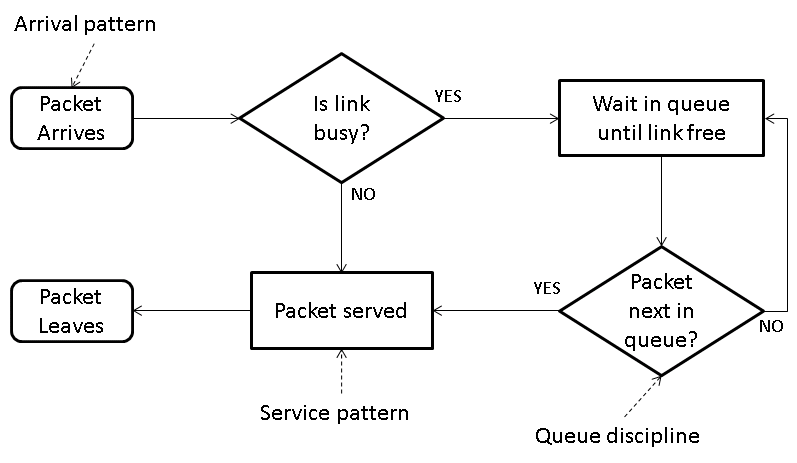
This problem may be modelled as a single-server queue. The data forms the customers waiting for service and once data is being transmitted, it is being "served" by the link.
The interarrival and processing times are given by exponential and triangular distributions respectively. Although the interarrivals are
Markovian, the service times are not. Thus we cannot use the
M/M/1 queueing model analytical solution and must solve this problem numerically via simulation.
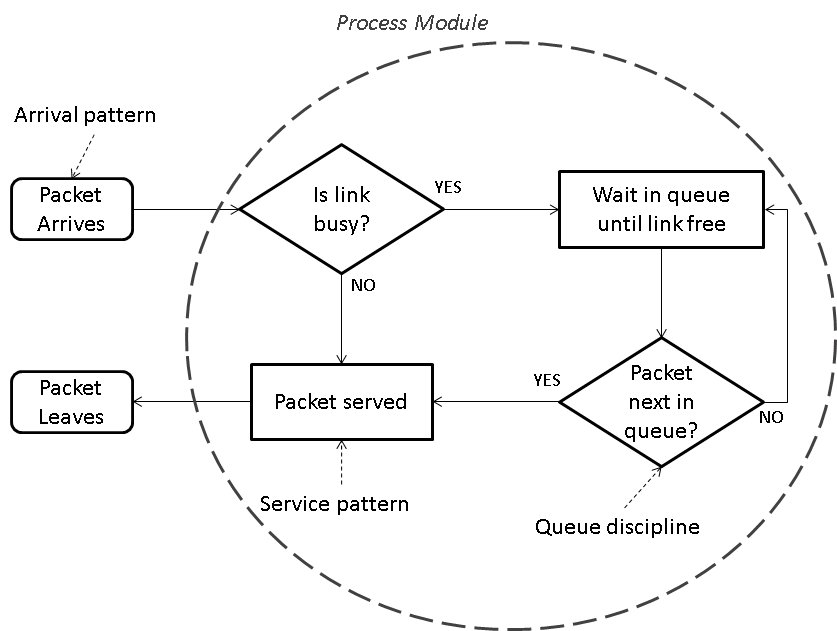
We build a flowchart that describes the "journey" of packets waiting to be transmitted along a link.
 Return to top
Computational Model
This model requires one instance of each of three flowchart modules:
Create,
Process and
Dispose. Data is created at the
Create module, moves to the
Process module to be transmitted across the link and then leaves via the
Dispose module. The
Process module automatically implements the queuing and service steps in our formulation flowchart for well-understood, e.g., first-in first-out, queue disciplines.

See the
Arena Guide for a
demonstration of adding and connecting modules.
The time between arrivals of data is exponentially distributed with mean 1 minute. We can
edit the Create module to implement this. Note that nothing interesting happens in the system until the first arrival, so we create the first arrival at the start of the simulation.
Figure 1 shows the completed
Create module.
Figure 1 Create Module

| Name |
Data Arrives |
| Entity Type |
Data |
| Time Between Arrivals Area |
| Type |
Random (Expo) |
| Value |
1 |
| Units |
Minutes |
If you are following along, you may want to save your model at this point.
Now that you've have defined the
Data entity type, you may want to
change its initial animation picture. Try making data appear as
Picture.Blue Ball.
Now that data is arriving, you need to send it across the link (and store it in the buffer if necessary).
Edit the Process module to set the time for data to cross the link according to a triangular distribution with minimum value 0.5 minutes, most likely (mode) 1 minute and maximum 1.5 minutes.
Figure 2 shows the completed
Process module.
Figure 2 Process Module

| Name |
Transmission across Link |
| Action |
Seize Delay Release |
| Resources (secondary dialog via Add button) |
| |
Type |
Resource |
| |
Resource Name |
Link |
| |
Quantity |
1 |
| Delay Type |
Triangular |
| Units |
Minutes |
| Minimum |
0.5 |
| Value |
1 |
| Maximum |
1.5 |
If you are still following along, now is a good time to save your model.
You can click on the
Resource or
Queue data modules in the
Basic Process template to see the
Link resource and
Transmission across Link.Queue. If you needed to edit the resources or queues you could do it here, but we can simply use the defaults for this model.
Finally,
rename the Dispose module to reflect data leaving the system.
Figure 3 shows the final
Dispose module.
Figure 3 Dispose Module

Building an Animation
While not necessary for this simulation model to work, it is always nice, and very useful for demonstrations, to have an animation of the systems we are simulating. In this model we would like to
edit and animate the link resource.
Here we will use an empty link (a simple rectangle) to show an idle link and a link with an arrow to show a link that is transmitting data.
Figure 4 shows the different pictures for the
Idle and
Busy states.
Figure 4 Resource Pictures

The last addition to our model is a
dynamic plot that will keep track of the amount of data in the buffer waiting for the link. We
add a dynamic plot and use the
Expression Builder to set it to plot the number of entities in the
Transmission across Link.Queue.
Figure 5 shows the dialogues for the dynamic plot.
Figure 5 Dynamic Plot

| Plot |
Series 1 Properties (secondary dialog via Add button) |
| |
Source Data |
| |
Name |
Link: Number Waiting |
| |
Expression |
NQ(Transmission across Link.Queue) |
| |
Line |
| |
DrawMode |
Stairs |
Now your
Arena model is complete. Save your model and get ready to gather some results.
Return to top
Results
Once your
Arena model is complete, you can run the model for multiple replications and get estimates for various different quantities.
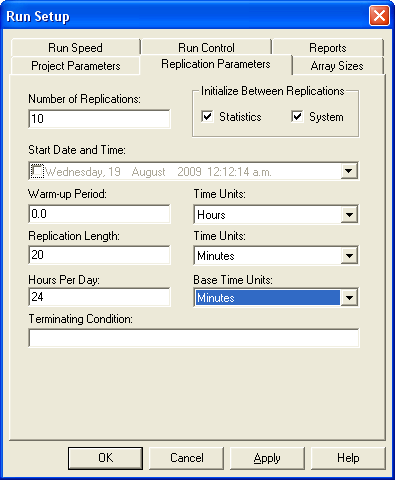
Run your simulation for 10 replications with no warm-up period. The
Base Time Units should be
Minutes and the replication length should be 20 minutes. All other entries should remain at default values.
Figure 6 shows the completed
Replication Parameters.
Figure 6 Replication Parameters

| Number of Replications |
10 |
| Replication Length |
20 |
Time Units |
Minutes |
| |
Base Time Units |
Minutes |
Debugging
When you run your simulation you will get some errors complaining about
Link. Unfortunately, Arena uses
Link as a system variable, so we cannot name any simulation modules, i.e., entities, modules,
resources,
Link. You can change the name of the
Link resource to
Cable Link or
Link Resource and then use
F4 (=
Run > Check Model) and
Find to replace
Link everywhere.
Once you have run your simulation you can look at the
Category Overview report, or more specifically the estimate for the amount of data waiting for transmission. The report shows that the number in the queue is 2.0795 ± 1.20.
If you close the report and look at your dynamic plot, you can see how the amount of data waiting in the queue changed over the 20 minutes examined.
Figure 7 shows screen shots of the report and the dynamic plot.
Figure 7 Simulation Output

 Return to top
Conclusions
The purpose of this simulation was to estimate the buffer size needed for the output port connected to the link. The length of the buffer queue is 2.0795 ± 1.20, i.e., [0.8795, 3.2795] is the 95% confidence interval.
Given that the maximum size of the data is 11.25 GB and we are 95% sure the average buffer length is less than 3.2795, a buffer of 11.25 × 3.2795 = 36.894375 GB should suffice.
However, further simulation that breaks the data down into packets and models the rejection of packets upon finding a full buffer could be used to observe the behaviour of output buffers of different sizes.
Note that the animation in the simulation model can be used to show the behaviour of the buffer over time (particularly the dynamic plot).
Return to top
 Return to top
 See the Arena Guide for a demonstration of adding and connecting modules.
The time between arrivals of data is exponentially distributed with mean 1 minute. We can edit the Create module to implement this. Note that nothing interesting happens in the system until the first arrival, so we create the first arrival at the start of the simulation. Figure 1 shows the completed Create module.
Figure 1 Create Module


 The last addition to our model is a dynamic plot that will keep track of the amount of data in the buffer waiting for the link. We add a dynamic plot and use the Expression Builder to set it to plot the number of entities in the


 Return to top

