Displaying and Printing in AMPL
How many decimal places?
When solving mathematical programming problems, the accuracy of your solutions should never be more than the accuracy of your data. You can set the precision for displaying values in AMPL via thedisplay_precision option. For example, if your inputs are specified to 4 significant digits, e.g., 0.013, you can use
option display_precision 4;to get your solution values to the same number of significant digits.
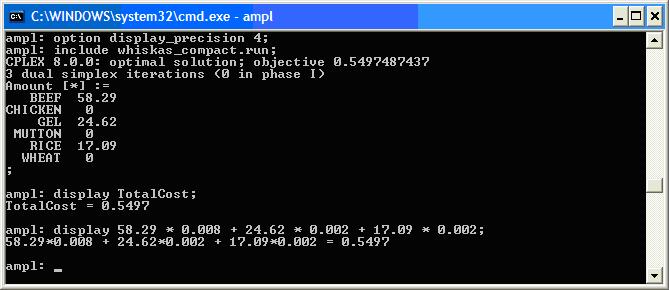 Note that AMPL still keeps its numbers at full precision, so you need to be careful with your objective function values.
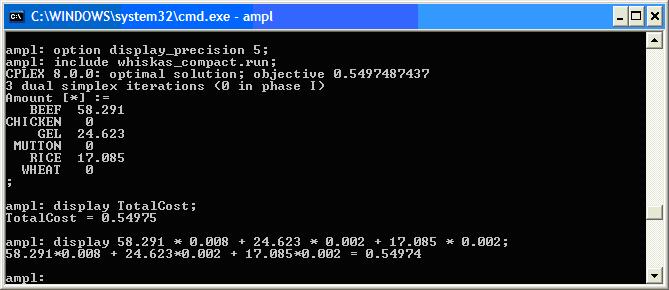 When we change the
 display_precision to 5 significant digits, the displayed TotalCost and the cost calculated by using the displayed Amount values differ. If you are using rounded solution values, make sure to check the objective value before quoting your solution.
Displaying Information
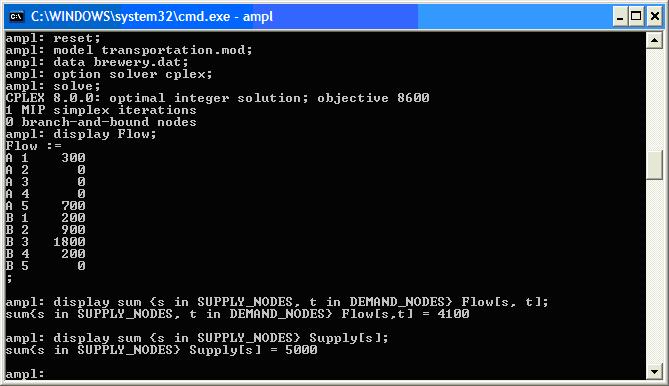
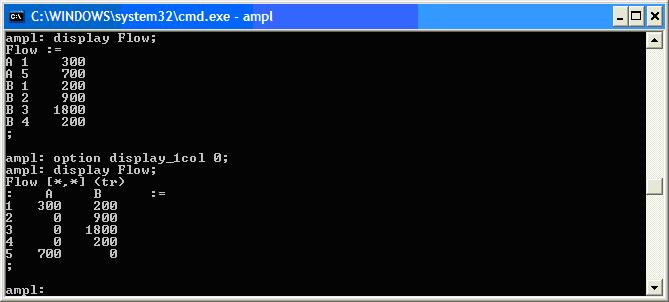
You have already seen how to display a variable using thedisplay command. We can also display AMPL expressions the same way, e.g., we might want to see how much supply we are using in a transportation problem.
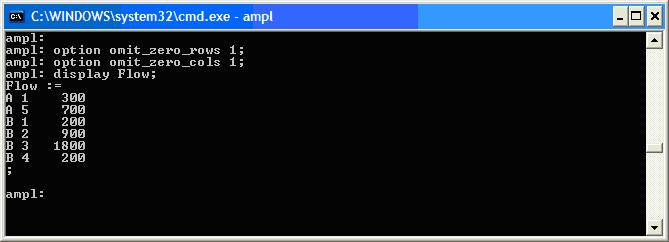
 Often when we display something (like variable values) many of the resulting numbers are 0 and we are only interested in the non-zero numbers. To stop any rows of zeros being displayed you can set the
 omit_zero_rows option:
option omit_zero_rows 1;To stop any columns of zeros being displayed you can set the
omit_zero_cols option:
option omit_zero_cols 1;
 You can also force
 display to use either tables or a single column by using the display_1col option. This option will use one column if the number of values to display is less than display_1col. The initial value of display_1col is 20, so any display command that shows less than 20 values will be displayed as a column. Setting display_1col to 0 forces display to use tables whenever possible.
Printing Information
By playing with thedisplay options we can get the display command to format output in a nice way. However, we can also decide exactly what is displayed by using print and printf.
 The
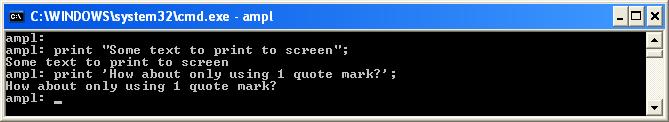
The print command only writes strings to the output.
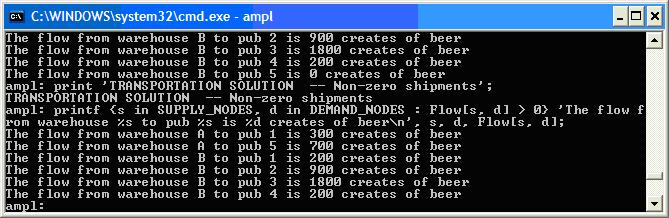
The printf command allows you to print text and values together in a format you can control. It uses the same printf format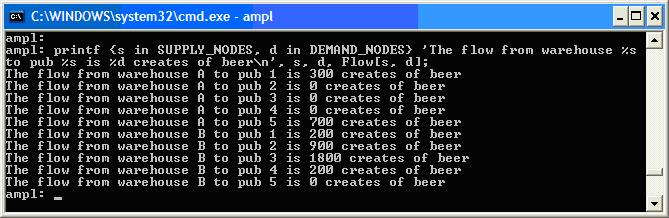 You can print over sets or set expressions as well
Printing to a File
All the output commands can be directed to a file. Adding> <filename> to the end of an output command creates the file with the given name and writes to it. Subsequent output commands append output to the file by adding >> <filename> to the commands. You should close your file when done so you can open it with another program. This is very useful for saving your solutions (in a useful format with printf), for example
# brewery.run
reset;

model transportation.mod;

.
.
.

data brewery.dat;

.
.
.

option solver cplex;

solve;

print 'TRANSPORTATION SOLUTION -- Non-zero shipments' > brewery.out;

display TotalCost >> brewery.out;

printf {s in SUPPLY_NODES, d in DEMAND_NODES : Flow[s, d] > 0}
  'Ship %d crates of beer from warehouse %s to pub %s\n',
  Flow[s, d], s, d >> brewery.out;

close brewery.out;
Running brewery.run in AMPL creates a file brewery.out:
TRANSPORTATION SOLUTION -- Non-zero shipments
TotalCost = 8600

Ship 300 crates of beer from warehouse A to pub 1
Ship 700 crates of beer from warehouse A to pub 5
Ship 200 crates of beer from warehouse B to pub 1
Ship 900 crates of beer from warehouse B to pub 2
Ship 1800 crates of beer from warehouse B to pub 3
Ship 200 crates of beer from warehouse B to pub 4
-- MichaelOSullivan - 02 Mar 2008
This topic: OpsRes > WebHome > AMPLGuide > AMPLSyntax > PrintingInAMPL
Topic revision: r8 - 2009-10-09 - MichaelOSullivan
Ideas, requests, problems regarding TWiki? Send feedback