Difference: SupplyChains (4 vs. 5)
Revision 52008-03-31 - MichaelOSullivan
| Line: 1 to 1 | ||||||||
|---|---|---|---|---|---|---|---|---|
Supply Chains | ||||||||
| Line: 16 to 16 | ||||||||
| Figure 1 shows the flow of materials (raw or finished) in a supply chain. | ||||||||
| Changed: | ||||||||
| < < | Figure 1 An example of a supply chain (adapted from Supply Chain Management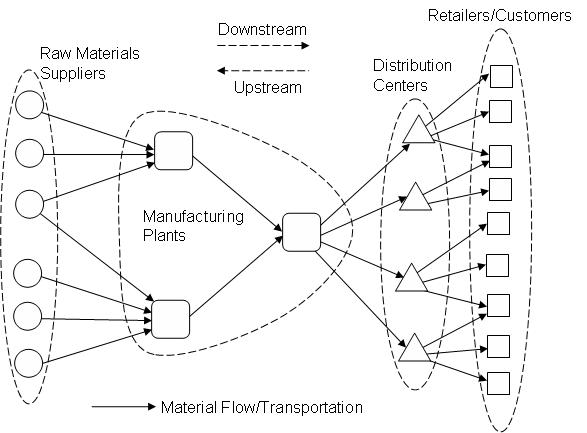 | |||||||
| > > | Figure 1 An example of a supply chain (adapted from Supply Chain Management | |||||||
| Return to top | ||||||||
| Line: 24 to 26 | ||||||||
| There are 3 types of decisions made in a supply chain, shown in Figure 2. As Figure 2 shows there is a hierarchy inherent in these decisions and the upper level decisions (at the top of the pyramid close bracket here - Lauren directly affect the lower level decisions, e.g., the monthly production plan at a manufacturing plant is directly affected by the decision about whether to build the plant or not, the daily production levels at a manufacturing plant are directly affected by the monthly production plan. Would it be better to use semicolons to separate longer ideas like those listed in the previous sentence? - Lauren However, the lower level decisions indirectly affect the upper level decisions, e.g., it is often cheaper to buy land to build a production plant in rural areas, but the day-to-day transportation costs from rural locations may be much higher. | ||||||||
| Changed: | ||||||||
| < < | Figure 2 Hierarchy of Supply Chain Decisions (adapted from Supply Chain Management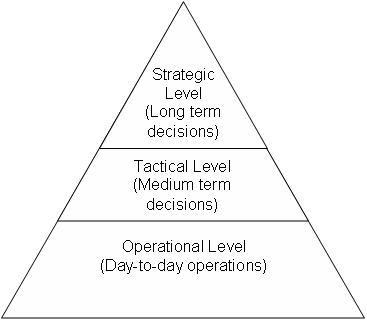 | |||||||
| > > | Figure 2 Hierarchy of Supply Chain Decisions (adapted from Supply Chain Management | |||||||
| Return to top | ||||||||
View topic | History: r9 < r8 < r7 < r6 | More topic actions...
Ideas, requests, problems regarding TWiki? Send feedback