| META TOPICPARENT |
name="SubmitCaseStudy" |
<-- Ready to Review -->
<--
This template controls both the look and functionality of case study topics.
You should not need to alter the layout, only edit the data using the form above.

Set the view and edit templates:
Comment out the next line to use the TWiki default view
Comment out the next line to use the TWiki default edit
-->
<--
This topic can only be changed by:
-->
Submitted: 19 Feb 2008
Application Areas: Data Analysis
Contents
Problem Description
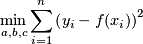
Also known as The Least Squares Problem When modelling data, scientists often want to fit an analytical model to their experimental data. In this case an experiment has provided some
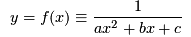
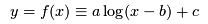
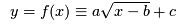
  -coordinates that have a growth curve shape, i.e., initially -coordinates that have a growth curve shape, i.e., initially  increases quickly with increases quickly with  , thens tails off to some maximum value. The scientists in this study have suggested three possible functions to model this behaviour: , thens tails off to some maximum value. The scientists in this study have suggested three possible functions to model this behaviour:
-
-
-
Given one of the possible functions  and the data points and the data points  they want to find they want to find  , ,  and and  to minimize the squared distance between the data points and the estimates, i.e.,
The scientists have specified the number of data points and their coordinates in an AMPL
data file regression.dat.
The scientists want to know which of the suggested functions provides the best fit to the data.
Return to top to minimize the squared distance between the data points and the estimates, i.e.,
The scientists have specified the number of data points and their coordinates in an AMPL
data file regression.dat.
The scientists want to know which of the suggested functions provides the best fit to the data.
Return to top
Problem Formulation
The formulation...
Return to top
Computational Model
The computational model...
Return to top
Results
The results...
Return to top
Conclusions
In conclusion...
Return to top
<--

-->
<--
- Write AMPL files
regression.mod and regression.run that use regression.dat to solve The Data Fitting Problem. Write a management summary of your solution. Be sure to indicate which of the functions fits the data best.
What to hand in Your new AMPL files regression.mod and regression.run. Your management summary.
-->
|*FORM FIELD ProblemDescription*|ProblemDescription|*Also known as The Least Squares Problem*
When modelling data, scientists often want to fit an analytical model to their experimental data. In this case an experiment has provided some -coordinates that have a growth curve shape, i.e., initially increases quickly with , thens tails off to some maximum value. The scientists in this study have suggested three possible functions to model this behaviour:
-
-
-
Given one of the possible functions and the data points they want to find , and to minimize the squared distance between the data points and the estimates, i.e.,
The scientists have specified the number of data points and their coordinates in an AMPL
data file regression.dat.
The scientists want to know which of the suggested functions provides the best fit to the data.|
|*FORM FIELD StudentTasks*|StudentTasks|
- Write AMPL files
regression.mod and regression.run that use regression.dat to solve The Data Fitting Problem. Write a management summary of your solution. Be sure to indicate which of the functions fits the data best.
What to hand in Your new AMPL files regression.mod and regression.run. Your management summary.
| |